


Customer Journey Analytics: How to Measure Impact and Engagement
To deliver incredible experiences your customers love, you need to understand how customers use and navigate your brand’s products and services.
Historically, customer journey analysis was a manual process that involved sifting through usage data. Brands then had to piece together engagement behavior to identify drop-offs and develop an engagement strategy. However, this process meant that brands were unable to act on breakdowns in the customer journey in a timely fashion.
Modern journey analysis leverages technology that automates procedures, empowering teams to act quicker and draw more impactful insights from omnichannel customer journeys. It enables teams to take an insights-led engagement approach to customer engagement, allowing them to understand how customers interact at every stage.
To help you navigate customer journey analysis, we explore what it means, why it’s important, and the top key performance indicators (KPIs) to measure.
What is Customer Journey Analytics?
Customer journey analytics refers to the process of analyzing how customers interact with your brand across the entire customer journey. It involves tracking, measuring, and analyzing each interaction your customers have across all available touchpoints to learn how they feel about their experience.
As a crucial element of a brand’s overall marketing strategy, customer journey analysis is hyper-focused on analyzing the actual journeys themselves. Typically, this process involves mapping the customer journey in a way that can easily be visualized, factoring in every single interaction along the path. It then involves using this information to dig deeper into your customers’ decisions, helping you understand what motivates them to interact with your brand or, alternatively, what’s holding them back from engaging.
Ultimately, customer journey analytics provides brands with a clear understanding of how their customers (and prospects) behave along the different pathways, helping them identify what incentivizes them to engage and convert.
Importance of Measuring the Customer Journey Effectively
Across industries, brands understand that a top-notch customer experience is a major competitive differentiator.
However, while brands often think the world of their own customer experiences, it’s not always the case that their customers feel the same way. Quite often, there is a clear disconnect between what a brand and its customers think about its customer experience. This disconnect means that many brands fall short of delivering exceptional customer experiences.
According to Business Wire, 87% of companies believe they provide an excellent customer experience (CX), but only 11% of their customers agreed. Many companies remain unaware of this gap because they don’t have the data necessary to quantify the effectiveness of their customer journeys.
Being able to measure the customer journey empowers brands to realize a number of benefits.
1. Quantify engagement across the customer journey
Measuring interactions enables brands to actually quantify retention and churn across the customer journey. This enables brands to put real numbers to the interactions they’re seeing so they can make data-driven decisions.
Pro Tip: Make sure to choose specific, actionable metrics that lead to meaningful improvements to your customer journeys. Don’t get sucked into vanity metrics that may be fun to look at, but don’t actually provide value.
2. Understand how customers interact with your product and service
Backed by verifiable data, customer journey analytics provides companies with a clear picture of how customers interact with their brand so they aren’t simply relying on their best guess. Brands are then able to better distinguish what parts of the journey are the most (or least) engaging.
Measurable KPIs help brands understand how customers progress through the journey in practice, and identify what is and isn’t working for your customers. With the right customer insights, brands can isolate what motivates their customers to engage and convert, what gives them anxiety, and what could push them to churn.
Ultimately, customer journey analytics enables brands to deeply understand their customers and make data-driven decisions on their behalf.
3. Determine priority channels
Analyzing engagement across the customer journey is a great way to identify which channels your customers are using most, as well as which ones are being entirely neglected. This allows you to choose your priority channels, and even isolate which channels are best for which type of messaging.
4. Isolate winning value propositions
With raw data on engagement across the customer journey, it’s much easier to quantify which strategies and content are most effective. Brands can hone in on what value propositions are driving the most engagement, and then use this information to improve future journeys and campaigns.
5. Collect, accurate, and reliable behavior data
Get valuable data on how customers interact along the customer journey, providing insights into how they engage with your brand.
When leveraged properly, this doesn’t just give you historical data, but actually helps you develop predictive insights that optimize customer journeys for greater engagement and improved retention.
Brands should rely on an omnichannel analytics strategy that gives them a 360° view of their customers to truly understand customer activity and behavior and extract meaningful insights that let them improve their customer journeys.
6. Increase customer acquisition and product adoption
By deeply analyzing and understanding how customers traverse the customer journey, brands are better poised to create seamless flows that hook new visitors’ attention and motivate them to become first-time customers.
This data empowers brands to identify which channels are bringing in the highest traffic (and which aren’t), allowing them to optimize their omnichannel strategy accordingly. Brands are also better positioned to motivate app downloads and newsletter opt-ins, enabling further communication. This allows brands to connect more consistently and effectively with customers via different channels, from social media to the web, to mobile apps. Leading brands can orchestrate journeys that make onboarding easy and convenient, improving customer acquisition and service adoption.
7. Increase customer retention and mitigate churn
By understanding what drives your customers at each stage of the customer journey, you’re better equipped to engage them on the right channel, at the right time, with the right messaging.
This empowers brands to optimize the journey for their customers, improving traction, increasing engagement, and resulting in greater conversions. Brands can hone in on which strategies are working best, optimizing for better performance. At the same time, brands can identify what elements of the journey are contributing most to churn and then plug those gaps.
8. Build a customer-centric experience
Without knowing what your customers want, you’ll never be able to deliver. And if you can’t deliver what they want, you’ll struggle to keep your customers, let alone keep them engaged. Analyzing your customer journeys allows brands to craft journeys that aren’t just ideal in theory, but are actually best for your customers in practice.
Continuously improving the customer journey based on how customers engage ensures you keep your customers at the center of your experience. By building the customer journey based on customer preferences and demands ensures you deliver high quality customer experiences that your customers love.
At the end of the day, this is what leads to customer satisfaction, which is the cornerstone of engagement, retention, and revenue.
9. Establish KPIs for measuring customer engagement
Not all metrics are as valuable as others. That’s not to single out any metrics in particular; one metric may be essential for a specific company in one industry, but it could be virtually meaningless to another company in a different (or even the same) industry.
Conducting regular customer journey analysis will help brands hone in on which metrics are telling them the most about customer engagement, and which help them best predict — and adapt to — customer behavior. This helps brands choose the key performance indicators (KPIs) that they lean on to measure the effectiveness of their customer engagement programs.
18 Customer Journey Metrics & KPIs to Measure Campaign Success
To extract data-driven insights from your customer journey analysis, you need to ensure that you rely on practical metrics that measure the performance of your customer pathways.
Below, we look at some of the most important metrics for analyzing the success of your customer journeys at different stages.
1. Impressions
Relevant Stage: Awareness
Impressions represent the number of times a customer is exposed to your marketing content, whether or not they actually interact with it. In general, it’s an indication of the overall reach and exposure a customer journey is able to achieve.
Impressions are not specific to individual customers, but each individual interaction. That means that if a customer has multiple interactions with your brand, each one would be considered an impression.
Most commonly, an impression is counted every time a customer views an advertisement or message. For some industries, impressions can also include likes, shares, and even comments made.
For customer journey analysis, it’s commonly used to measure the exposure a customer journey receives, as it quantifies the number of people who actually see a specific marketing message or advertisement.
2. Visitors
Relevant Stage: Awareness
Visitors are customers that visit your website for the very first time.
In some cases, this will be their first interaction, but in others, this will be the result of an impression through advertising, social media, print media, or even a word-of-mouth referral. The number of new visitors is an indication of how successful your customer journey is at drawing in new customers, which is crucial for understanding the performance of your customer acquisition efforts.
3. Lead generation
Relevant Stages: Consideration
Leads refer to prospective customers that have shown an interest in your product, service, or brand, and that you are actively nurturing into being first-time buyers.
Typically, lead generation involves focusing on customers who are likely to have (or who have exhibited) high buying intent or potential. Lead generation is a strong indicator of the success of the awareness and consideration stages in your customer journey.
4. Open rate
Relevant Stages: Awareness / Consideration
The open rate represents the rate at which customers open a notification, advertisement, or other marketing message that they’ve received.
In general, this metric measures the actual exposure your campaigns get. More specifically, the open rate can signify how successful your messaging is at enticing customers to view it. Typically, a high open rate is a good indicator of well-crafted subject lines and well-targeted messaging. In customer journey analysis, the open rate highlights which campaigns are more or less successful at driving engagement.
5. Click-through rate (CTR)
Relevant Stages: Awareness / Consideration
The click-through rate (CTR) represents the rate that customers click a notification, advertisement, or other marketing message that they’ve viewed.
In general, this metric measures how successful an impression was at eliciting a click. It’s crucial for customer journey analysis, as it helps brands understand the rate at which customers interact with a particular notification, message, or advertisement. Particularly, it provides key insights into what messages are successfully driving customers further down the customer journey towards a conversion event.
6. Conversion rate
Relevant Stage: Decision
The conversion rate indicates the rate at which customers complete a conversion event. While a conversion event is commonly a completed purchase, it can also be a completed sign-up, opt-in, app download, completed onboarding sequences, and more.
The conversion rate is a strong indicator of the overall success of your customer journey, as it indicates how well your pathways are leading to completed conversions. Essentially, this measures a brand’s ability to drive customers to complete a particular action. For this reason, it’s one of the most important metrics for measuring the overall success of your customer journeys, and whether they are effectively achieving their intended outcomes.
7. Abandonment rate
Relevant Stage: Decision
The abandonment rate represents the rate at which customers abandon a purchase they’ve initiated.
In the context of customer journey analysis, the abandonment rate is used to analyze and understand where and why customers abandon the checkout process. High abandonment rates at different stages in the customer journey can signal weaknesses in your customer journeys that need to be addressed. This helps brands hone in on where their customer journey is falling short so they can make meaningful improvements.
8. Sales
Relevant Stage: Decision
Sales measures the total value earned from products and services sold to customers within a given period of time.
In general, sales are a strong indicator of the success of your customer journeys during the decision stage, as high sales indicate that customers are converting at a high rate or spending higher amounts per order. In a sense, sales is an indirect indicator of how well your customer journeys are meeting customer expectations and needs.
While sales is an important metric, it doesn’t factor in the operational and marketing costs required to earn those sales. For this reason, brands often use other metrics that further break down the sales performance, such as Average Order Value (AOV) and overall revenue.
9. Cost per conversion
Relevant Stage: Decision
The cost per conversion represents the amount it costs a brand for each conversion. While this is commonly used to analyze the cost per purchase, it can also be used to analyze the cost for other conversion events, such as an impression, a click, or a lead.
Cost per conversion is used in customer journey analysis to determine how costly the customer journey is to create, run, and maintain compared to the value it’s generating. Leading brands are always finding ways to optimize their customer journey to mitigate costs, without impacting the actual success rate of the pathway.
10. Customer retention rate
Relevant Stage: Retention
The customer retention rate represents the rate at which customers continue to use a particular brand or service over a specified period of time.
In customer journey analysis, the customer retention rate is used to analyze how many customers stay in the customer journey at each step. It’s a strong indicator of how successful your customer journey is at keeping customers satisfied and engaged.
11. Churn rate
Relevant Stage: Retention
The churn rate is the rate at which customers stop engaging with your brand. In the most basic sense, the churn rate represents the rate at which you’re losing customers. The churn rate is always the inverse of the retention rate.
Using churn rate in customer journey analysis allows brands to identify how many customers are being lost at each step of the customer journey. This can be used to isolate weaknesses in the customer journey. Brands can then use this information to make adjustments that remove friction and streamline the buying process so customers proceed further along the pathway towards conversion and reconversion.
12. Customer Lifetime Value (CLV)
Relevant Stage: Retention
The customer lifetime value (CLV), also sometimes abbreviated as LTV for Lifetime Value, represents the average value a customer provides to your company over their entire lifetime as a customer.
The customer lifetime value (CLV) can be useful in determining the success of your customer journeys, and even comparing the performance of customer journeys against each other.
13. Daily Active Users (DAU)
Relevant Stages: Consideration / Retention
Daily active users (DAU) represents the number of customers who access or use your service on a daily basis.
DAU can also be used to determine the DAU rate, which is the percentage of customers that are DAUs.
DAU and the DAU rate are used to track website and mobile app usage and are strong indicators of customer engagement and retention at different points in time. A high DAU rate means that your customer journey is effectively engaging and satisfying customers, as they regularly return to use your product or service.
14. Monthly Active Users (MAU)
Relevant Stages: Consideration / Retention
Monthly active users (MAU) represents the number of customers that access or use your service on a monthly basis.
MAU can also be used to measure the MAU rate, which is the percentage of customers that are MAUs.
MAU and the MAU rate are used to track website and mobile app usage, and (like DAU and the DAU rate) are strong indicators of the success of customer engagement retention efforts at different times.
15. Stickiness
Relevant Stages: Retention
Stickiness is a retention metric that compares the engagement of active users over a narrow period of time to those over a broader period of time. Most commonly, this is used by comparing DAUs to MAUs, but it can theoretically be done by comparing any two different time frames.
In customer journey analysis, brands use stickiness to understand engagement and retention. Brands also compare stickiness at different stages of the customer journey to identify weaknesses and make adjustments.
16. Customer Satisfaction Score (CSAT)
Relevant Stages: Retention / Advocacy
The Customer Satisfaction Score (CSAT) is a metric that measures how satisfied customers are with a brand’s products or services. Collected from customer feedback, it’s a direct reflection of customers feeling about the customer experience. This can be used to identify areas for improvement.
17. Referral rate
Relevant Stage: Advocacy
The referral rate represents the number of purchases that have been generated from referrals.
The referral rate is a strong indicator of how successful your customer journeys are at driving brand loyalty and advocacy. After all, only the most satisfied customers will refer others. The actual rate at which these customers then make a purchase is also an indication of how strong and impactful those referrals are.
For example, a high number of referrals shows that your customers are extremely satisfied with their experience. But a high referral rate may also indicate how strongly your brand loyalists advocated on your behalf.
18. Net Promoter Score (NPS)
Relevant Stage: Advocacy
The Net Promoter Score (NPS) is a metric that measures the likelihood a customer will recommend a brand. It’s commonly used to measure customer sentiment regarding the customer experience and perceived brand loyalty.
In terms of customer journey analysis, it’s a strong indicator of how successful your customer journey is at building brand loyalty and advocacy.
6 Customer Journey Analytics Examples with MoEngage
When you’re looking for a customer journey analytics solution, it’s critical that you find a tool that helps you actually measure the impact of your efforts. You’ll need to be able to deeply understand how customers interact with your brand across the entire customer journey so you can optimize your campaigns for improved engagement.
Below, we look at various customer journey features that MoEngage offers to help brands manage and improve their customer journeys to maximize engagement and retention.
1. User path analysis [for analyzing customer journeys]
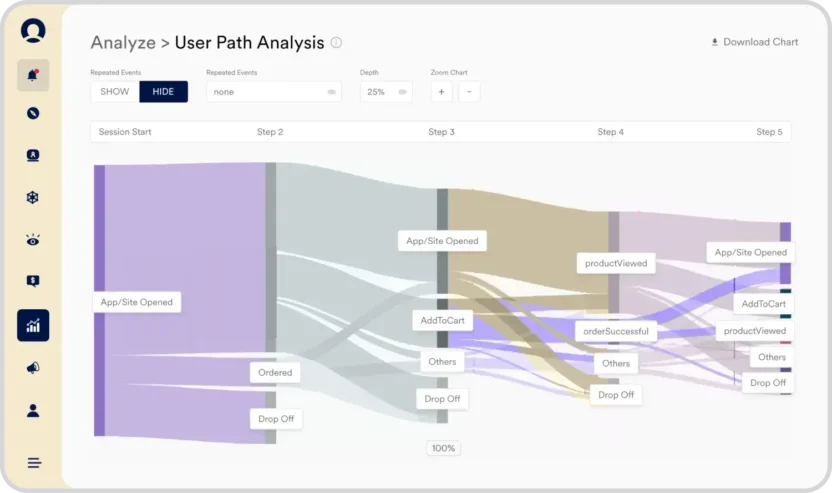
MoEngage’s User Path Analysis feature allows you to visualize every path your customers take. With forward user paths, you are able to choose an initial action, seeing where customers proceeded from that point. With reverse user paths, you’re able to work backwards from a final customer action to see where different users come from. Both of these user pathways enable you to identify optimal paths and remove bottlenecks in the customer journey.
With this you’re also able to show or hide repeated events to draw engagement insights. You can also filter the paths by user type, the time frame before or after an action, the number of steps, or a specific date range to hone in the data.
To find out exactly how we can help you optimize your customer journey, check out our case study on how we helped Empiricus increase conversion by 45% using MoEngage’s user path analysis.
2. Retention analytics [for conducting cohort analysis]
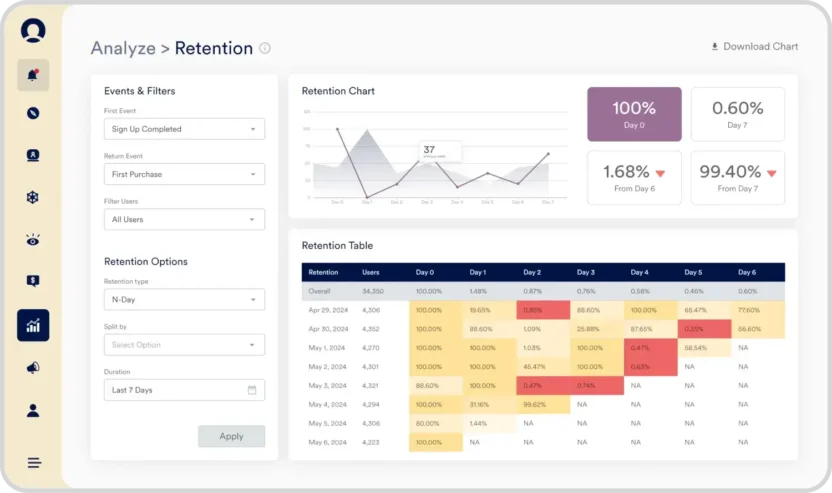
MoEnage’s customer retention feature allows you to track and measure retention following a particular event (or series of events). This tool enables you to track and analyze retention across cohorts, based on when they perform a particular action. Using this data, you’re better able to identify, predict, and reduce customer churn.
Using this functionality, you could create a cohort for customers who have signed up and returned to make a first purchase. You can then track retention for customers who meet these initial criteria, allowing you to do a deep dive into the performance of customer retention efforts.
Pro Tip: Before you start, keep in mind there are a lot of misconceptions about customer retention. To help you avoid these pitfalls, we explore the most common customer retention myths brands fall into.
3. Uninstalls tracking [to identify and address churn along the customer journey]
MoEngage’s uninstalls tracking feature enables you to visualize and analyze uninstalls based on individual customers and their device types. This uninstall data helps you understand when people drop-off and what events lead to those drop-offs. Once you’re able to narrow down when and where these drop offs are occurring, you can begin to analyze reasons why customers are uninstalling your app.
You can even refine their analysis by time or attribute, allowing you to drill down on data and hone in on the data that matters most. By filtering based on attributes, you’re able to look at uninstalls in relation to customer lifetime value, revenue, and much more.
Our real-time uninstall tracking capabilities allow you to react immediately after a customer uninstalls, so you can implement a customer recovery campaign aimed at bringing this customer back.
4. Funnel analysis [to track journey progression]
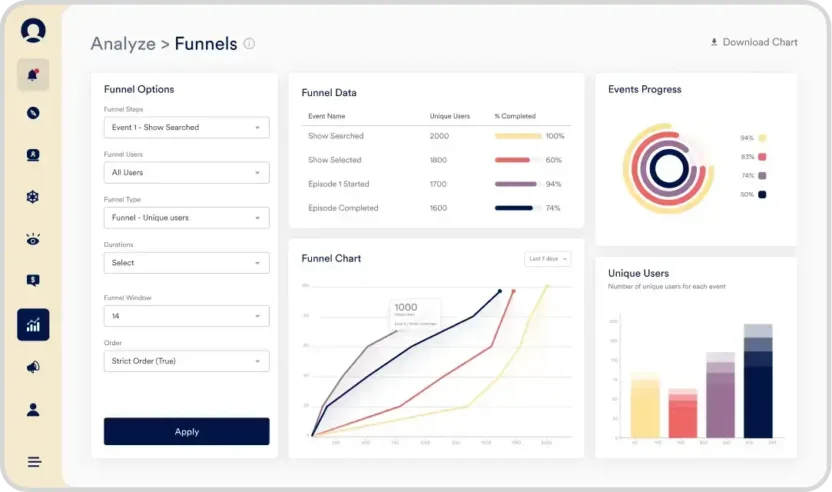
MoEngage’s Funnels feature enables brands to analyze conversion funnels to better understand engagement throughout the funnel. Unlike user path analysis, funnels are highly focused on specific conversion goals, which allow you to clearly understand how well you’re guiding a customer toward a specific objective.
Using this feature, you can gather insights into how the customer interacts with your web or mobile application, as well as analyze the related customer behavior. This allows you to understand how customers interact with your brand at various stages in the customer journey, as well as assess the effectiveness of your campaigns.
For example, Media & Entertainment brands can track the performance of different shows in detail, seeing exactly how many customers searched, selected, started, and completed an episode. This empowers brands to not only identify where drop-offs are occurring, but also analyze the rate at which customers are dropping off at different stages of a funnel. These brands can then hone in on the point in the customer journey with the least impact and optimize to improve traction.
5. Predictions [to forecast customer actions and deliver dynamic journeys]
MoEngage’s Predictions feature allows you to predict customer actions based on previous activity patterns from your customers. There are out-of-the-box templates for predicting both conversions and uninstalls. These can be further customized, or prediction flows can be created entirely from scratch based on different customer scenarios.
Predictive marketing allows you to anticipate conversions, uninstalls, and dormancy, as well as act in real-time to develop strategies and employ campaigns that nudge customers in the right direction. This allows you to increase conversion rates, reduce uninstalls, and mitigate dormancy. More importantly, you can do this at scale, so you’re able to serve this level of personalization to millions — if not billions — of customers. You can build prediction models that look at your customers’ propensity to open an email, convert on a particular brand, or abandon your service.
See more about how our Predictions feature enabled Franki to achieve a 225% uplift in conversions and Publishers Clearing House to re-engage 30,000 dormant app users.
6. Acquisition analytics [to help you analyze the region, source, and value of customers]
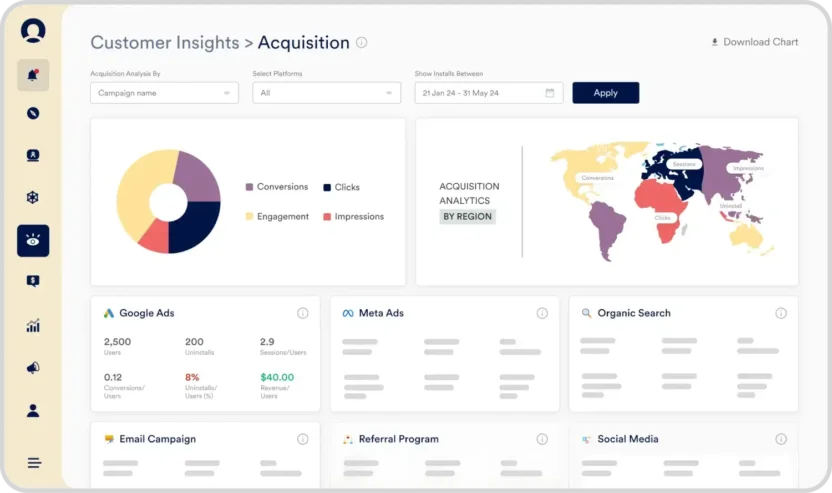
MoEngage’s Acquisition feature gives you a comprehensive overview of acquisition efforts, allowing you to see overall performance and identify where customers are coming from. You can hone in on the most popular sources and channels for acquisition, allowing you to understand where customers are coming from, as well as optimize your acquisition efforts.
Get raw data on how many customers are continuing through the conversion funnel, with details on how many users, sessions per user, conversions per user, and revenue per user. You can then drill down on specific campaigns, platforms, and time frames to get more detailed insights.
Customer acquisition certainly comes with its set of challenges. Check out our webinar on the most common user acquisition challenges that explores issues of discoverability and fragmentation.
Perfect Your Customer Journey Analysis with MoEngage
Customer journey analysis is all about understanding how customers interact with your brand at different stages along the customer journey. It enables brands to actually measure and quantify the performance of the customer journey, empowering them to make data-driven decisions about what to focus on improving. Brands that leverage this information to make impactful updates to the customer experience find their engagement and retention initiatives to be far more effective.
MoEngage’s omnichannel marketing solution helps brands get reliable data on how customers interact with each touchpoint in the customer journey through user path analysis, uninstall tracking, and funnel analysis. These data visualizations provide brands with deep insights into customer activity and behavior so they can isolate drop-offs and address churn.
Schedule a demo today to learn how MoEngage can help you analyze — and optimize — your customer journeys to maximize engagement.