


How to Execute and Measure Your Omnichannel Analytics Strategy
Reading Time: 15 minutes
More than ever in today’s data-powered world, knowledge is power. The more information brands have at their disposal about their customers, the better equipped they are to create brand messaging that resonates with their audience.
Comprehensive data collection gives you actionable omnichannel analytics that let you truly understand your customers. In turn, you can use this data to create highly personalized, omnichannel marketing campaigns that leverage customer habits, patterns, and preferences.
In fact, our 2024 Cross-Channel Marketing Report shows that 33.1% of marketers say leveraging customer data is the most significant contributing factor to making effectively targeted omnichannel marketing decisions.
In this article, we’ll discuss the concept of omnichannel analytics, how to implement it into your strategies, and what key performance metrics you should analyze to reveal the impact of your campaigns.
What is Omnichannel Analytics?
Omnichannel analytics is the process of collecting and analyzing the data of customer interactions across all channels that a brand uses to engage them. This allows brands to holistically understand their customers and offer them a consistent, seamless, and uniquely personalized experience across all touchpoints. It also helps brands understand how each of the channels they use to communicate with customers are performing.
Modern customers no longer interact with brands from a single touchpoint. Instead, most customers connect with brands through a myriad of channels that are both physical and digital, prompting many brands to undergo digital transformations that allow them to provide a seamless experience across online and offline channels.
Omnichannel analytics empowers brands to deeply understand their customers by unifying data from all of these interactions, creating a holistic picture of customer behavior, habits, and preferences.
5 Benefits of Using Omnichannel Analytics
As we’ll illustrate throughout this article, for you to truly connect with your customers in a meaningful way, you need to understand every interaction customers have with your brand, irrespective of the channel. And even more than that, this data can’t be disparate and siloed, it needs to be unified and cohesive to paint a clear, complete picture of customer engagement.
Omnichannel analytics is what allows you to create that complete picture, informing all of your customer engagement strategies and marketing campaigns.
Below, we look at the top benefits you can realize by using omnichannel analytics:
- Get a 360° view of the customer: Omnichannel analytics provides insights on every customer interaction across all touchpoints on all channels, providing you a holistic view of their customers’ preferences and activity.
- Improve channel selection: It helps you connect with your customers on the right set of channels by understanding which channels perform best. This further allows you to flexibly adjust your strategy to leverage the right channels for the right types of messages, and for the right audience
- Reach out at the optimal time: With a window into all customer interactions, you can be confident in when your customers are most likely to engage with your marketing campaigns and perfect the timing of your messages.
- Power deeper personalization: With a complete picture of each customer’s engagement patterns, you can better segment your customers to deliver hyper-personalized marketing campaigns that they love.
- Make predictions: By analyzing data from multiple channels, you can better predict customer behavior and make more informed decisions. When you can anticipate customer behavior, you can create experiences and journeys that meet those customer expectations.
- Quantify customer engagement: Omnichannel analytics empowers you to measure, understand, and optimize the performance of your customer engagement efforts. This helps you to take a more proactive approach and identify potential friction points in the customer journey, early on, and even predict things like customer churn.
In the next section, we look at how you can realize these benefits by using omnichannel analytics.
6 Tips to Implement an Omnichannel Analytics Strategy and Gain Deeper Insights
Omnichannel analytics isn’t just about collecting data, it’s about developing meaningful ways to leverage that data to make quality improvements in your campaign to drive more engagement. To do this effectively, you need to implement and execute your omnichannel strategies in a conscious, intentional way.
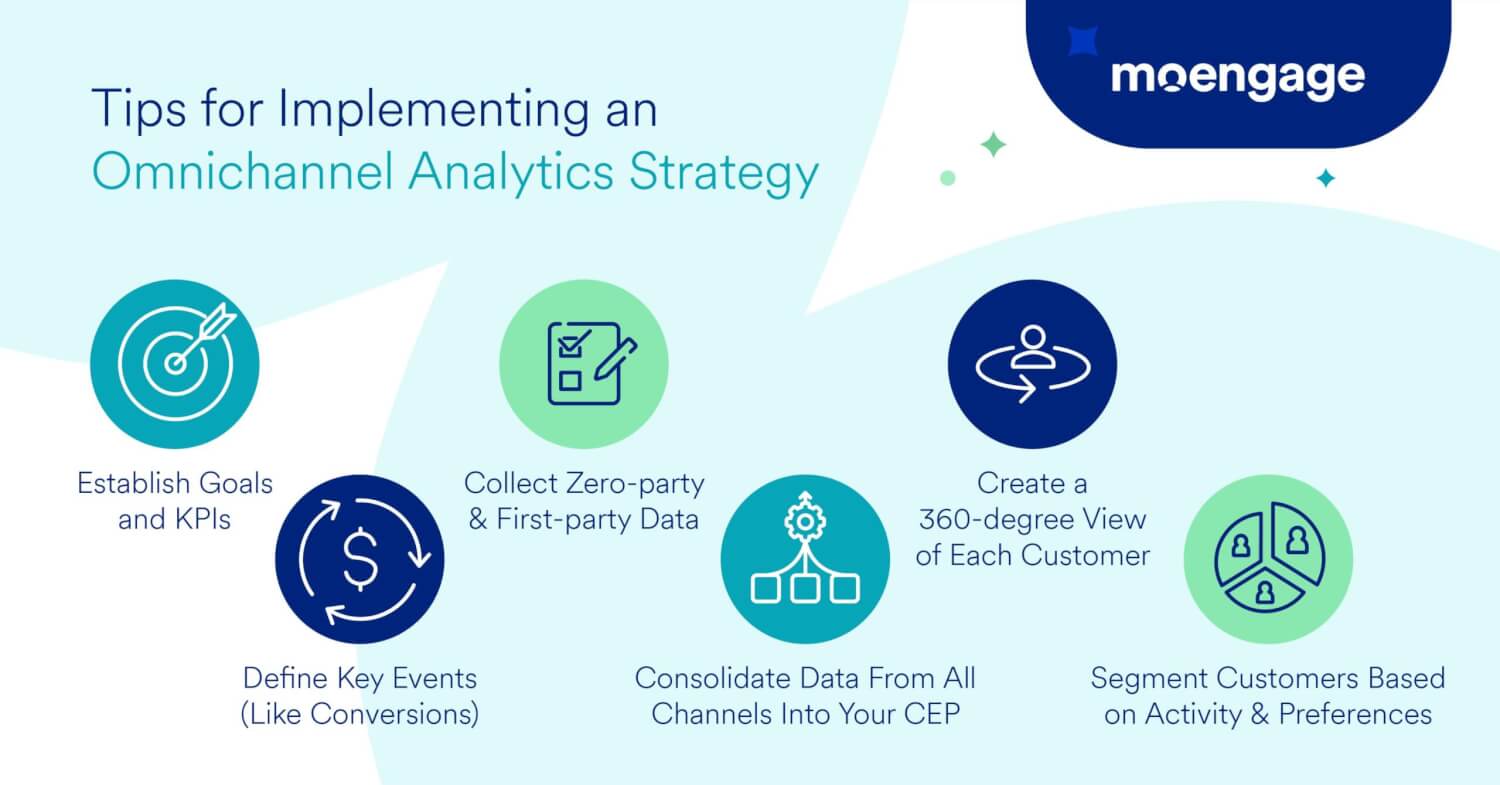
Below are tips to help brands such as yours, plan and deploy an omnichannel analytics strategy that will lead to actionable insights, and help to improve channel selection/management and campaign performance.
1. Outline your goals and establish the KPIs you’ll use to measure your success
Omnichannel analytics provides a quantitative analysis of channel and campaign performance so you can make data-driven decisions, whether that’s helping you select the right channel, properly time your messages, or find the right communication frequency.
First, as a B2C marketer, you need to determine what goals you care about most. Are you focused on acquiring new customers or improving retention? Are you focused on driving conversions, eliciting subscriptions, or increasing ad revenue? Make sure you define your goals and set achievable benchmarks to work towards.
Once you’ve defined your goals, select the metrics you’ll use to measure your success. Make sure the metrics you choose are closely related to what you’re trying to achieve. Think critically about how you plan on using this data to actually make improvements to your campaigns and channel selection.
2. Define key events to standardize your analytics
To achieve success, it’s important that marketers like yourself clearly define your conversion events, and any other key events across a customer’s buying journey.
Conversion events don’t just have to be a purchase or subscription, they can also be an account sign-up, a newsletter opt-in, or a mobile app download. Key events can be any action customers take that signal they are getting closer to these conversion events.
Think about what actions you want customers to take. How can you define, label, and track each of these individual events? Essentially, you’re defining the events that matter most to you as a brand and provide the biggest signals of success.
When you select useful conversion and key events that actually reflect your brands’ goals and objectives, you’ll be able to measure, analyze, and improve your performance.
3. Collect zero-party and first-party data
The more data you have, the more informed your decisions are. For omnichannel marketers, the right data can be the difference between a daily active user (DAU) and a lost customer.
Brands that want to offer hyper-personalized experiences that customers love can’t just rely on third-party data, they need to collect their own zero-party and first-party data to give them even deeper insights into customer activity, behavior, and preferences.
Unlike third-party data, zero and first party data comes from the source, representing direct customer interactions with your brand (rather than another company’s best approximations). This also doesn’t require you to navigate third-party consent regulations, as zero-party data is volunteered and first-party data is implied when customers engage with your product, service, or platform.
This leads to more actionable insights and meaningful improvements to your channel selection and campaign.
4. Consolidate data from all channels into your Customer Engagement Platform (CEP)
Customer information comes from all over. Whether you’re relying on zero-party or first-party, or third-party customer data, it is important that it is accessible in a unified platform that empowers teams to draw meaningful insights. A brand won’t benefit from data dispersed across various channels, spreadsheets, and siloed databases. When your data is spread out over different channels and databases, manually consolidating and analyzing it is extremely time-consuming.
Insights from our State of Cross-Channel Marketing 2024 report indicate that 20.8% of marketers are still using spreadsheets to conduct manual analysis for driving omnichannel marketing. And this is causing delays; 37.8% of marketers report that it takes them more than a week to launch a campaign, with 15.3% saying it takes them over a month.
Instead, leverage a unified Customer Engagement Platform (CEP) to ensure all customer insights are located in one place and no information is left out or misattributed. This empowers your marketing team to effectively leverage the omnichannel data you’re able to collect for both online and offline customer activity.
5. Create a 360-degree view of each customer
Interpreting the data accurately is just as important as gathering it. You must enable your teams for success by presenting the data in ways that they can productively interact with and act upon.
Omnichannel analytics are based on a comprehensive, 360-degree view of customers (and their interactions). This allows brands to better understand the customer journey and accommodate the dynamic buying behaviors of their audience. It also helps improve efficiency by giving marketers the opportunity to visualize, experiment and test different channel combinations and strategies against the customer data you have already collected before setting campaigns into motion.
6. Segment customers based on intent, activity, and channel preferences
Once you have a 360° view of all your customers, you can segment customers to understand which channels different groups prefer and the messaging that is most apt for each channel and use case. This allows you to choose the right channel of communication and deliver personalized campaigns that customers are more likely to engage with.
How to Measure Omnichannel Performance: Top 9 KPIs and Channel Metrics to Monitor
To really understand customer behavior, you need to deep dive into every touchpoint customers have with your business. To do this effectively, you need to analyze their customer journeys and isolate the KPIs that matter most to you along this process.
Below, we cover a traditional conversion funnel to help you understand which metrics you should be using to understand the performance of your omnichannel marketing strategy.
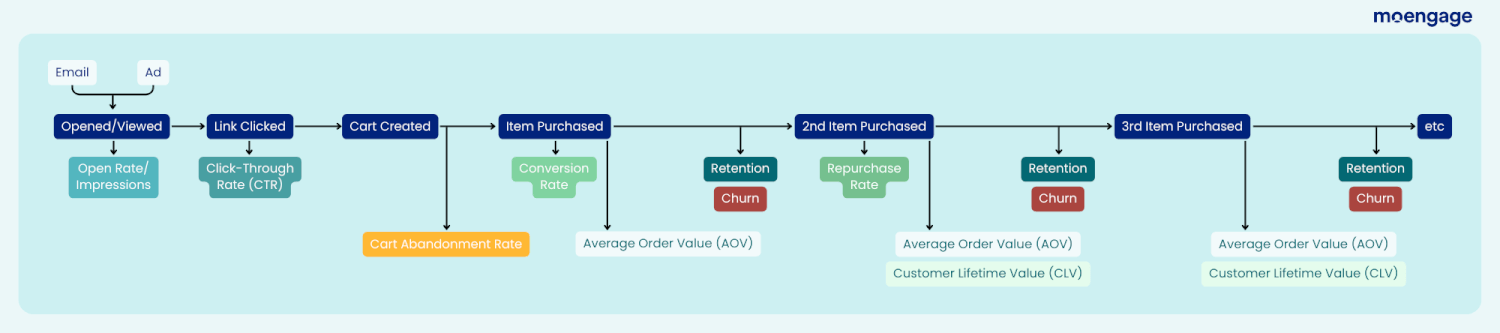
Armed with the right data, you can understand which omnichannel campaigns are most successful and which may be underperforming, enabling you to optimize (or retire) campaigns accordingly.
Below, we cover the 9 most important metrics for B2C marketers operating an omnichannel analytics strategy.
1. Open Rate
The open rate represents how many people open a message out of the number of people that received that message. While open rate is a common term for email marketing, this is extremely similar to the view rate or impression rate that are commonly used for other types of marketing.
The open rate is a good indicator of how well your campaigns are attracting — and grasping — customer attention. Is your messaging optimally timed to maximize visibility? Are your subject lines interesting enough to get customers to open (and read) your marketing messages?
Ultimately, the open rate helps brands understand which channels are right for different types of messages, based on which ones are eliciting engagement.
Campaigns with low open rates may be failing because they are using channels customers don’t prefer for that type of messaging. For example, a mobile push about a sale that’s two weeks away may not elicit much engagement; but an email with the same content may garner more activity.
Over time, you’ll want to test different email subject lines, delivery timing, and frequency to improve open rates and maximize overall engagement.
2. Click-Through Rate (CTR)
The click-through rate (CTR) represents the number of customers that perform a particular action (typically clicking a link) within a marketing message they’ve viewed or opened.
The CTR is a strong indicator of how well your marketing campaigns resonate with your audience, drive engagement, and get customers into conversion funnels. Is the content, imagery, and overall messaging hitting the mark and eliciting clicks?
If customers aren’t interested in clicking through to engage more with your content or products, then what you sent them simply isn’t resonating with them enough. Maybe the recommendation isn’t relevant, the offer doesn’t interest them, or the messaging simply missed the mark. Either way, you’ve failed to hook them enough to entice further engagement and need to revisit the channel, timing, frequency, and messaging you use for future campaigns.
3. Cart Abandonment Rate
The cart abandonment rate represents the percentage of customers that abandon a shopping cart after adding an item to it.
More than anything, the cart abandonment rate indicates the performance and health of your checkout process and funnel. From an omnichannel perspective, this can help you identify which platforms have poor checkout experiences, which touchpoints added friction, or which channels sent out inadequate communication.
This empowers brands to identify which aspects need to be improved to streamline checkout and mitigate friction. Teams can then craft effective cart abandonment emails and mobile push campaigns, optimizing messaging to better guide customers through to complete a purchase, a subscription, or order.
4. Conversion Rate
The conversion rate represents the percentage of visitors that complete a conversion event. As mentioned earlier, conversion events don’t just have to be purchases and subscriptions, they can be newsletter opt-ins, account sign-ups, or completed film viewings.
In general, the conversion rate is a solid indicator of the performance of your campaigns, as it proves they are working successfully. For omnichannel analytics, it can be used to isolate which channels are best at eliciting conversions and increasing revenue. Brands can compare the performance of different channels and individual campaigns to better leverage their channels in the future.
This leads to more completed conversion events that get customers to take the actions your brand wants; whether that’s a sign up, an opt-in, or an actual purchase or subscription.
5. Average Order Value (AOV)
The average order value (AOV) represents the average value of each order a customer makes, whether that’s a purchase, a delivery order, or a subscription. While AOV is the common term in ecommerce and retail, some industries (particularly those that operate on subscription models) may refer to this term as average subscription value (ASV) or something similar.
The AOV is an indicator of how well a brand is doing at driving higher cost purchases and upselling / cross-selling to customers. By comparing the AOV of different channels, brands can better understand which channels have the best performance (as well as which ones may need to be improved).
6. Repurchase Rate
The repurchase rate represents the number of visitors that make more than one purchase or subscription.
A high repurchase rate is a sign that customers were satisfied with their first interaction with your brand, and an early indicator of retention performance. The repurchase rate is one of the strongest contributors to an increase in customer lifetime value (CLV), which makes each acquisition more valuable. Fostering repurchases is the first step towards long-term retention and deep-rooted brand loyalty.
Understanding which channels and campaigns are most effective at leading customers towards repeat purchases helps brands understand what customers want (and don’t want) in an experience and product. Brands can then optimize how they use channels and fine-tune campaigns to garner greater engagement, driving up their CLV and increasing revenue.
7. Customer Retention Rate
The customer retention rate represents the percentage of customers that remain after a specified period of time.
The customer retention rate indicates a brand’s ability to keep customers interested and engaged with their brand. Brands use this metric to understand how effectively they are driving traction and developing brand loyalty with customers. A high retention rate means your engagement strategy is working well. It may even be a sign that it’s a good time to focus on cross-selling and upselling to your customers.
Omnichannel marketers use customer retention rates to compare the performance of different channels and campaigns, allowing them to identify which channels provide the best experiences for customers and keep them engaged. This helps with channel selection for individual campaigns and how they determine priority channels.
Brands operating omnichannel strategies that put customers first are heavily focused on customer retention, as it’s a strong measure of engagement and a signal for long term growth.
8. Churn Rate
The churn rate represents the percentage of customers that a brand has lost in a specified period of time. The churn rate is the inverse of the customer retention rate, and it’s also an essential metric for analyzing customer retention.
The churn rate is an indicator of a poor experience, whether it’s because of the wrong channel, messaging, frequency, or timing. Fortunately, if brands can isolate where in the customer journey churn is most acute, they can identify the greatest friction points in the customer experience and then make improvements to mitigate churn.
When used properly, omnichannel marketers can use the churn rate to identify where the biggest drop-offs are occurring in your conversion funnels (and how this differs across channels). This empowers B2C marketers to make improvements and close these gaps.
9. Customer Lifetime Value (CLV)
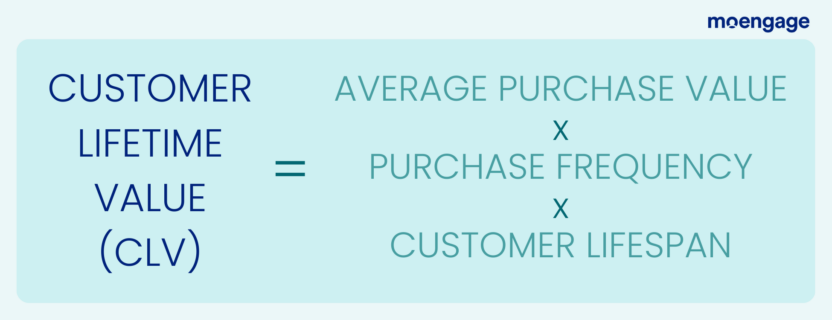
Customer lifetime value (CLV), sometimes stylized simply as lifetime value (LTV), represents the total amount the average customer will spend throughout their entire time as your customer.
The customer lifetime value enables brands to determine the true value of each customer acquisition. This is a solid signal of brand growth and success, but it also allows brands to make more effective decisions about how they allocate their marketing budget. As brands drive engagement, retention, and repeat purchases or subscriptions, the CLV will increase.
For omnichannel markers, the overall CLV is a crucial metric for measuring the health of their omnichannel strategy, as a rising CLV is a good sign of company success and growth. It can also be used to effectively compare the general performance of different channels and campaigns. It empowers you to hone in on your most valuable customers, and deeply understand the frequency, timing, tone, and channels that impress them most.
Omnichannel Attribution: What It Is and Why It Matters
Attribution is crucial to omnichannel analytics. After all, if your goal is to compare the performance of different marketing channels, you’ll need to be able to attribute data to a specific channel and campaign.
Even more importantly, you’ll need to trust that this data is accurately attributed to be confident in the data-driven decisions you make.
If your data can’t be attributed to a specific channel (or you can’t do it accurately or correctly), it won’t be helpful in guiding you in the right direction.
Omnichannel attribution ensures that all interactions are accounted for across the customer lifecycle. It also helps you find out the channels responsible for bringing in different customers.
Using omnichannel attribution, marketers are able to analyze all customer touchpoints across all marketing channels, providing them a holistic view of their customer engagement campaigns. More importantly, it empowers teams to accurately quantify engagement in a meaningful, actionable way.
For example, let’s say a customer has the following activity history with your brand:
1. A consumer sees — and clicks — a Facebook ad for your service and lands on your mobile website. Then they browse your products for a while, before closing their browser.
2. A few days later, they visit your desktop website, and browse through some clothing items.
3. They visit an in-store location, try on some of the clothing items they saw online, as well as some additional items they only saw after visiting the store. They then buy one item they looked at online, and two items they saw in-store. They also give the cashier their contact number and email, and opt-in to receive offers and other marketing materials.
Now, up to this point, it’s pretty safe to attribute the lead generation to the mobile channel, as the customer was first generated through a Facebook ad. However, it’s both the mobile ad and desktop that gets them in-store, making an actual purchase. And it required them being able to visit in-store, and try on the clothes to actually complete the purchase.
So, how do you attribute this conversion? Is it equally weighted between all three? Or is the in-store given more weight because it’s the most recent touchpoint?
Let’s continue.
4. Post the shopping, an email thanking the customer for their recent purchase is automatically triggered. This email also incentivizes them to download the mobile app and register as a member of the company’s rewards program by offering them extra points for completing their recent purchase. The customer signs up and enables mobile push notifications.
5. A couple of days later, a mobile push notification is triggered that welcomes them to the loyalty program, and offers them a guided onboarding experience that will help them navigate the mobile app. The customer ends up adding a few items to their cart, but doesn’t complete the purchase.
6. The next day, another mobile push notification is automatically triggered, reminding the customer of their abandoned cart. It encourages them to return and complete the online order, which they do.
At this point, the email campaign is heavily responsible for incentivizing mobile app adoption, while the mobile push campaigns are heavily responsible for driving a repeat conversion. However, it’s really this entire sequence that is working cohesively to get the customer towards that second purchase — and on track to long term retention.
7. A week later, an email alerts the customer of an upcoming sale.
8. A day before the sale, a mobile push is sent to remind the customer that the sale will be running that weekend.
9. The day of the sale, another mobile push lets the customer know the sale is currently on.
10. The customer browses products via the mobile app, and in-app messages guide the customer along the conversion funnel, resulting in a completed order.
Here, email and mobile channels are being used together to foster continued engagement and drive repeat conversions. But there are still challenges in deciphering this data. How impactful is each channel? Is mobile push the most valuable because it’s used the most? Or is in-app messaging most important because it’s the most recent touchpoint prior to purchase? Or is email most important because it gets the lead into the conversion funnel in the first place?
11. After 1 month of dormancy, geofencing is used to trigger an automated mobile push, which alerts the customer of an ongoing sale in a nearby store. The customer sees the mobile push in real-time, clicking it to view the details about the sale.
12. They then turn around to visit the store, where they make another purchase.
Again, how much credit is attributed to each channel? The entire sequence was only possible because the customer walked by the physical location, but it’s a mobile push that actually alerted them of the sale. However, it’s the visit to the store that closed the deal. Which gets the most credit, and why? And what was most critical in acquiring them, converting them, and retaining them? What role did each interaction play in this process?
Here, we have a situation where disjointed metrics would provide an incomplete picture of the customer journey. And understanding customer behavior gets increasingly challenging with every interaction. Add to it the number of customers and each customer having their own journey and channel touchpoints.
In the world of omnichannel engagement, there are nearly infinite customer pathway variations, making it extremely challenging to deeply understand how your customers engage with your brand. As you can imagine, analyzing this data is extremely challenging, especially when it’s siloed and has to be done manually.
Savvy marketers understand that each channel, campaign, and individual interaction — when leveraged properly — can have an impact. They also know that they need to employ a reliable customer engagement platform that can automate the entire process and provide actionable insights.
Get Deep Insights That Let You Truly Know Your Customers with MoEngage
Omnichannel analytics is essential to not only executing an omnichannel marketing strategy, but also creating personalized marketing campaigns and customer experiences that maximize customer engagement.
When used effectively, omnichannel analytics enable brands to deeply understand customer needs and preferences by providing data on every single interaction your customers have with your brand.
This gives brands the ability to deliver omnichannel experiences and marketing campaigns that customers love and want more of.
The best part about MoEngage is that it removes the need of guesswork from your customer engagement strategy by providing you omnichannel analytics via self-serve dashboards. You can quickly and easily deploy campaigns, track and review performance, and optimize campaigns, all from a single place. With actionable insights that allow you to understand dormancy and uninstalls, you’re better equipped to prevent churn and optimize customer LTV by delivering marketing communication on the right channel at the right time.
Schedule a demo to learn how MoEngage can help you perfect your customer engagement strategy by giving you the insights you need to make data-driven decisions.