


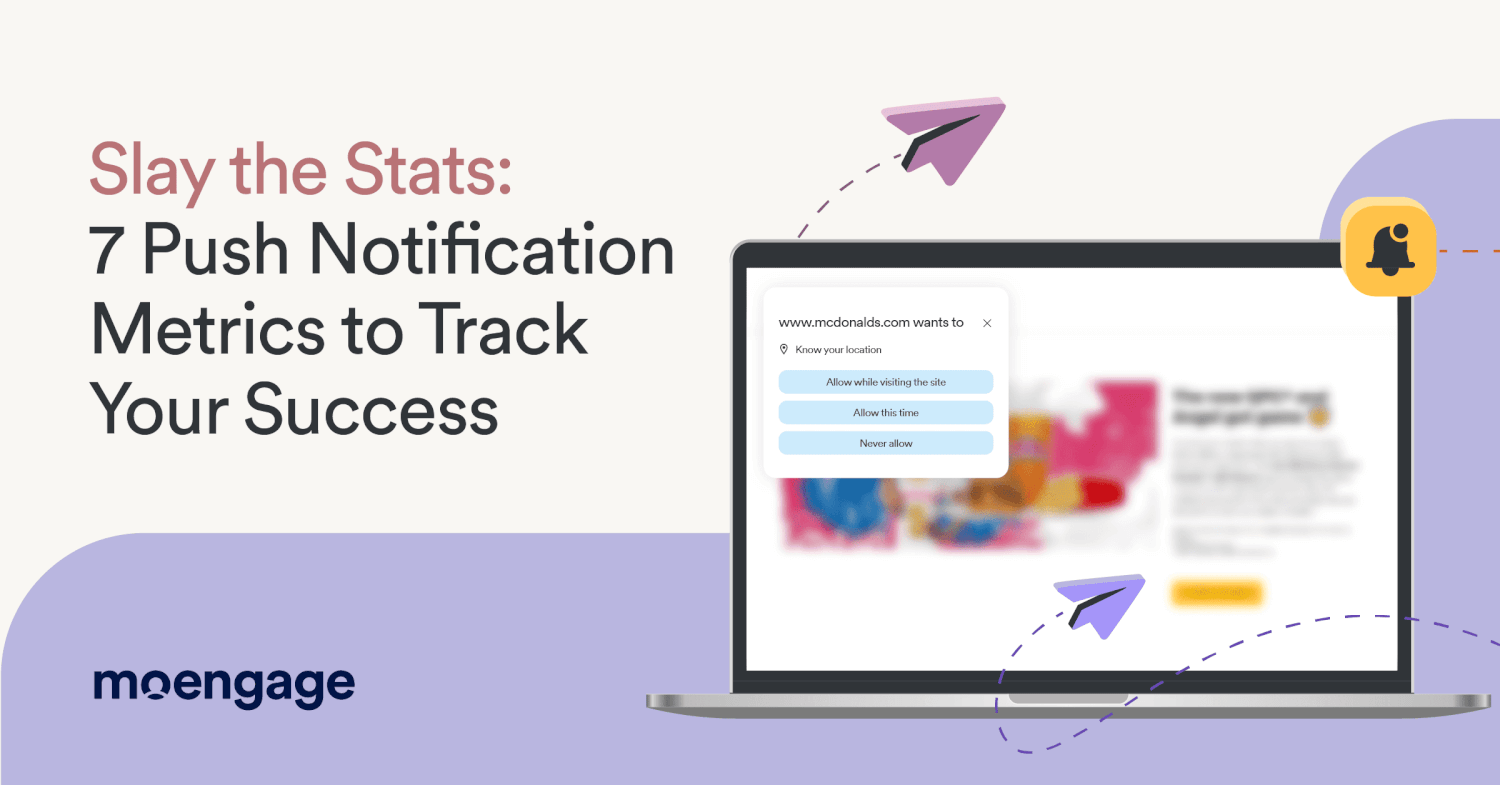
Push Notification Metrics & KPIs to Track in 2026
Let’s be honest—how many push notifications do you actually tap on? Probably not many. And your users? They’re no different. Every day, their phones buzz with updates, promos, and alerts, most of which get swiped away without a second thought. It all comes down to the right push notification metrics—if you’re not tracking what works, you’re just adding to the noise.
Push notifications can drive massive engagement—when done right. But too many brands blast out generic, poorly-timed messages that do nothing but annoy users. And then they wonder why their CTR is tanking.
So, here comes the next question: Are your mobile and web push notifications helping your business grow, or are they just adding to the noise? If you’re not obsessing over open rates, retention impact, and actual ROI, you’re leaving money on the table.
In 2026, success isn’t just about sending more messages—it’s about sending the right ones, at the right time, with the right intent. And that starts with understanding the push notification metrics that actually matter.

Let’s break down what’s working, what’s not, push notification best practices, and how to turn your push notifications into a real engagement and revenue machine.
How to Measure the Effectiveness of Push Notifications
Not all push notifications are effective. Some drive clicks and conversions, while others get ignored, annoy users, or even lead to app uninstalls. So, how do you separate what’s working from what’s not?
The key lies in tracking the right push notification metrics and understanding their impact on user behavior. It’s not just about sending messages—it’s about knowing which KPIs matter, how your performance stacks up against industry benchmarks, and how to maximize ROI.
Here’s what we’ll break down:
- Push Notification Metrics & KPIs: The numbers that actually tell you if your campaign is working.
- Benchmarks That Matter: How to compare your performance—like open rates, click-through rates, and conversions—with industry standards and know if you’re ahead or behind.
- Generating Real ROI: Because clicks mean nothing if they don’t drive revenue.
Let’s step right into it.
Top 7 Push Notification KPIs & Metrics Most Important to Campaign Performance
As we discussed before, if you’re sending web or mobile push notifications without measuring their impact, you’re flying blind. The right push notification metrics help you understand how to optimize your campaign for better engagement, retention, and revenue. Let’s break down the most important push notification metrics you need to monitor.
1. Push Notification Click Rate
Push notification click rate or click-through rate (CTR) tracks the percentage of users who not only receive your push notification but actually click on it. This tells you if your message sparked enough interest among users for them to take action.
How to Calculate:
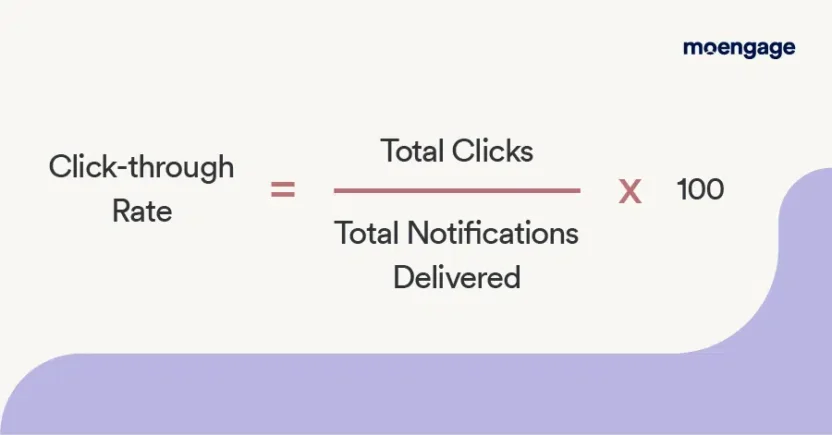
A high CTR means your notification was relevant and compelling. A low CTR? That’s a red flag—your message might be off, the timing could be wrong, or maybe your audience just isn’t interested.
Want better CTRs? A/B test your copy, use segmentation to target the right people, and time your notifications for when users are most active. Minor tweaks like this can have a considerable positive impact.
2. Push Notification Open Rate
Open Rate measures how many people actually opened your push notification after receiving it. Unlike CTR, which tracks clicks, this push notification metrics tells you whether your notification even caught the user’s attention in the first place.
How to Calculate:
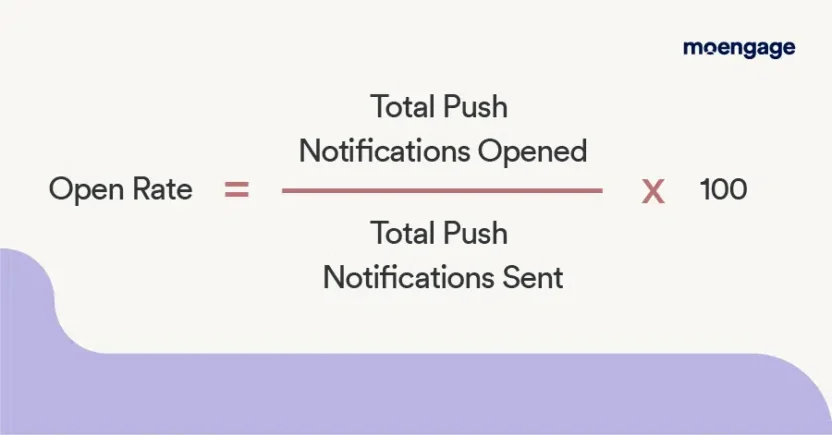
A strong open rate means your push notifications are breaking through the noise. A weak one? That’s a problem—it likely means your headlines aren’t grabbing users’ attention, or worse, users are ignoring your notifications altogether.
To boost push notification open rates, focus on:
- Personalization – Use the user’s name, preferences, or behavior-based triggers.
- Timing – Send notifications when users are most active (not in the middle of the night).
- Urgency & Curiosity – Give them a reason to open the notification (e.g., “Flash Sale: 2 Hours Left!”).
If people aren’t even opening your notifications, nothing else matters. So fix this first.
3. Push Notification Conversion Rate
Getting users to click and open your push notification is great—but does it lead to a desirable action? Conversion Rate indicates how many people actually accomplished the goal you wanted them to accomplish through your notification. It possibly includes buying, subscribing, watching a video, or any other move essential to your business.
How to Calculate:
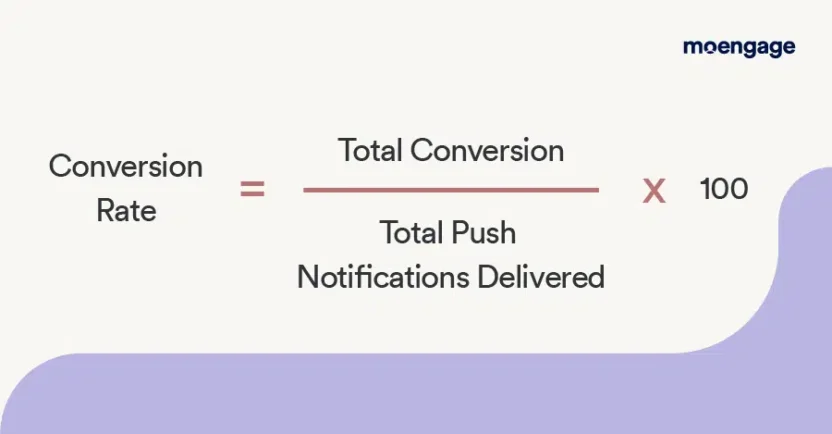
High open rates and CTRs are irrelevant if users aren’t following through on the goal. A weak push notification conversion rate usually signals one of these problems:
- Your landing page doesn’t match the notification’s promise.
- The notification’s offer isn’t compelling enough to act on.
- There’s friction in the process (too many steps, slow load times, or bad UX).
Fixing this isn’t rocket science—make sure your messaging flows seamlessly from notification to landing page, remove unnecessary steps, and test different CTAs to see what drives action.
At the end of the day, clicks are vanity metrics. Conversions pay the bills.
4. Push Notification Opt-In Rate
Opt-In Rate measures the percentage of users who agree to receive your push notifications when prompted. If people aren’t opting in, it doesn’t matter how good your notifications are—because they’re never getting delivered in the first place. It’s one of the most critical push notification metrics, directly impacting your campaign’s reach and effectiveness.
How to Calculate:
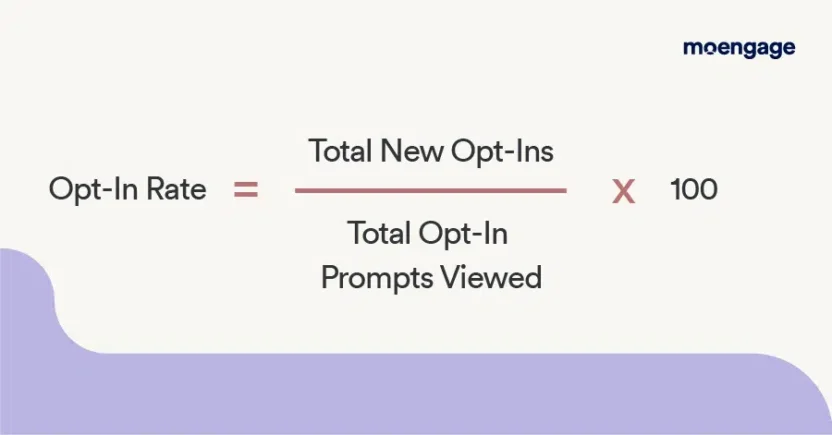
A low opt-in rate (below 5%) is a red flag—you’re either asking at the wrong time or not giving users a compelling reason to say “yes.” (Scroll to the next section to know the push notification benchmarks.)
How to Boost Your Push Notification Opt-In Rate
- Ask at the right moment – Instead of an instant pop-up, request permission after the user engages with the notification (e.g., after a key action).
- Show the value upfront – Don’t just ask—explain why they should opt in. (“Get exclusive deals & instant alerts!”).
- Use a soft prompt first – Instead of triggering the default system prompt, use a custom-designed message to warm users up.
Without opt-ins, your push campaigns are dead on arrival. Fix this ASAP, otherwise none of this matters.
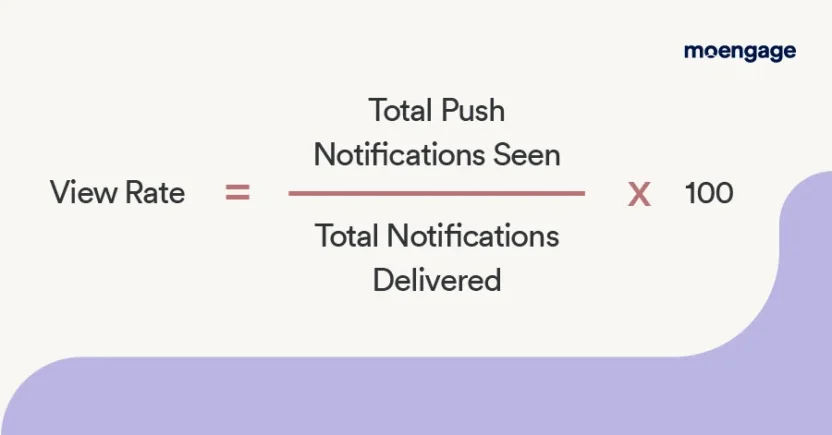
5. Push Notification View Rate
View Rate measures how many users actually saw your push notification—not clicked, just saw it—compared to the total number of notifications sent.
How to Calculate:
Why It’s Critical
A low view rate often points to issues like:
- Too many notifications → Users tune out spammy alerts.
- Bad timing → Sent when users aren’t active.
- Muted notifications → Especially common on iOS, where users have more control over notifications.
How to Improve Your View Rate
- Perfect Your Timing – Push when your audience is active, not when it’s convenient for you.
- Optimize Frequency – Bombarding users will lead to notification fatigue. Quality over quantity, always.
- Personalize, Don’t Spam – If users see value in your messages, they won’t ignore them.
A high View Rate means your notifications are actually making it onto the user’s screen—and that’s the first step to getting clicks, conversions, and ROI.
6. Push Notification Revenue Rate
Revenue Rate shows the percentage of direct revenue generated from push notifications relative to the number of notifications sent. It answers the key question: Are your push campaigns actually making money, or just noise?
How to Calculate:
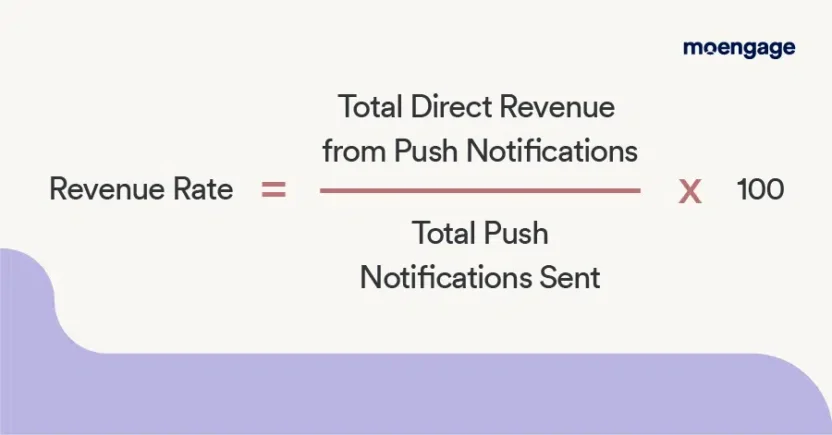
Clicks and views are great, but revenue is the ultimate push notification metric.
A strong revenue rate depends on your industry, but SaaS and e-commerce businesses should expect direct revenue from push campaigns, especially for:
- Limited-time flash sales
- Cart abandonment reminders
- Personalized product recommendations
How to Boost Your Revenue Rate
- Use Dynamic Segmentation – Don’t send the same message to everyone. Target your audience based on user behavior.
- Create Urgency – “Only 3 left in stock!” performs better than “Check out our new collection.”
- Make the CTA Clear – Confusing messages kill conversions. Tell users exactly what to do next.
If your push notifications aren’t generating revenue, they’re just distractions. Focus on data-driven, revenue-generating campaigns—not engagement for just engagement’s sake.
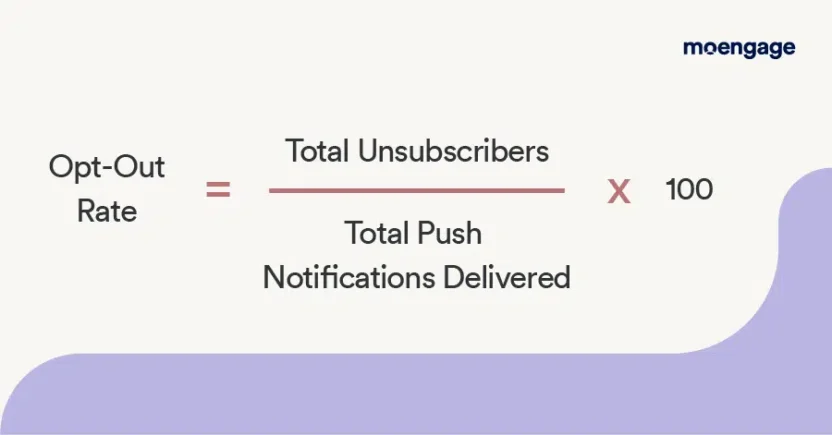
7. Push Notification Opt-Out Rate
Opt-Out Rate measures how many users actively unsubscribe from push notifications. In most push notification metrics, bigger numbers are better—but here, it’s the opposite. A rising opt-out rate is a clear sign something isn’t working, whether it’s the frequency, relevance, or quality of your notifications.
How to Calculate:
Users don’t unsubscribe for no reason. A high push notification opt-out rate typically means:
- You’re sending too many notifications – Bombarding users with notifications makes them frustrated.
- Your content isn’t valuable – If users don’t find your notifications relevant, they’ll leave.
- Bad timing or poor personalization – Notifications sent at the wrong time or with generic content drive users away.
How to Reduce Opt-Out Rates
- Classify Your Audience – Tailor your messages; not everyone needs the same notifications.
- Adjust Frequency – More isn’t always better; send only when it matters.
- Improve Content Quality – Deliver value, not just promotional noise.
- Offer Control – Let users manage preferences instead of a full opt-out.
Keeping an eye on your push notification opt-out rate is essential. If too many users are leaving, it’s time to rethink your strategy. Keep the numbers low, and your audience will stay engaged and happy.
Push Notification Benchmarks to Use as a Yardstick
Numbers without context are just noise. You might be getting a 3% CTR, but is that good? Bad? Average? That’s where industry averages come in—they provide context on how your push messages fare in relation to industry averages.
But here’s where things get interesting: benchmarks aren’t all the same. Your push notification metrics will differ based on your industry, target market, and the type of messages you send. Your flash sale reminder, for example, won’t have the same impact as your shipping confirmation message. And that’s why comparing apples to apples in your analysis is crucial.
Now, let’s talk real numbers:
1. Push Notification Opt-in Rate
On average, 67.5% of mobile app users opt in to receive push notifications. This gives you a solid baseline to measure how effectively you’re encouraging users to enable notifications.
If your opt-in rate is significantly lower, it’s worth evaluating how and when you’re asking for permission — and whether you’re clearly communicating the value users will get from opting in.
Opt-In Rates: Android vs. Apple
The arrival of Android 13 shook things up:
- Android Opt-In Rate: Dropped from 92% (2022) to 85% (2023) after Google introduced opt-in prompts.
- iOS Opt-In Rate: Rose from 55% to 58% during the same period.
Despite the dip, Android still leads iOS. But with Android now requiring consent like Apple, expect opt-in rates to continue declining.
Opt-In Rates: Web Push
The average opt-in rate for web push notifications is 5%. Furthermore, 74.1% of website visitors allow web push notifications on Google Chrome, while 8.9% consent to them on Firefox, and 6.3% on Safari.
Huddle up for the opt-in rates of desktop users by industry:
- Finance: 33% (Highest-performing industry)
- Mobility: 27%
- Media: 25%
- Services: 21%
- Retail: 31%

2. Click-Through Rates (CTR)
CTR measures how many users clicked your notification after receiving it. Average CTRs typically vary across platforms, but the real game-changer is personalization:
- Targeted & Contextualized Web Pushes: Achieve up to 20% CTR.
- Overall Average: Sits at around 2%, though transactional or hyper-personalized notifications can hit 30% or more.
CTR by Industry:
- Retail: 3.5% (Highest-performing industry)
- Services: 2.3%
- Leisure & Hospitality: 2.7%
- Media: 2.1%
- Mobility: 1.6%
If your CTRs are lagging, it’s time to A/B test your copy, fine-tune your targeting, and rethink your timing.
3. Reaction Rate
This push notification metric tracks user interaction—whether they swipe, click, or take in-app action after receiving a push. Overall, across all industries, approximately 7.8% of people interact with a push message in some manner—whether by swiping, clicking, or in-app activity.
If you’re far off from these numbers, it’s time to get more in sync—tweak your message, play around with timing, and dial in on audience segmentation. If you’re killing these averages, kudos to you—just make sure to constantly strive to get even better. Great push message tactics never go stale.
How to Generate ROI Using Push Notifications
Push notifications aren’t simply used to maintain user engagement—they’re used to drive sales if used smartly. The only difference between a push campaign that converts and one that is ignored is how it is executed. Blasting off random messages won’t work.
Instead, you require timely, personalized, and data-backed messages that drive people to take action.
Here, we’ll explore five tried-and-proven approaches to obtain maximum return on investment (ROI) through push messages.
1. Send Tailor-Made Offers According to User Activity
Generic promotions get ignored. Humans interact much more with offers that appeal to their passions and emotions. Instead of blasting all people with the same message, capitalize on user data to create push messages that resonate personally and make sense to people.
How It Drives Sales
- Customers engage more if they see things that actually resonate with them.
- Cut through the noise in marketing by giving your customers what they want. Such targeted offers persuade shoppers who are more likely to buy.
- Personalized messages convert up to 202% more than mass messages.
Example:
A fashion retailer observes that a consumer has repeatedly searched for sneakers, but has not bought anything yet. Instead of promoting a general offer message, they send out this tailored push message:
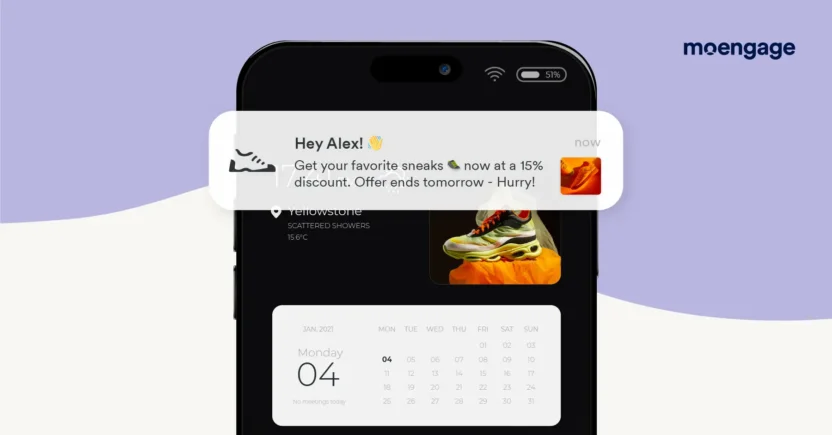
By adding a sense of importance and a human touch, this message makes the buyer think that the offer was custom-made to their specifications—urging them to take instant action.
How to Do It Properly
- Track user activity through their browsing history, wishlists, and cart additions.
- Segment your target audience based on their preferences.
- Use automation tools like MoEngage’s Dynamic Product Messaging to send personalized product recommendations.
- A/B test differing messages to see what works best.
2. Abandoned Cart Reminders
Abandoned carts are a gigantic lost opportunity—almost 70% of online shopping carts get abandoned. That’s leaving a huge amount of money on the table! All that’s needed is a friendly reminder at just the right moment to get people to follow through on their purchase.
How It Boosts ROI
Brings in shoppers who have shown their willingness to buy.
Creates urgency and reduces hesitation.
Abandoned cart reminders are proven to re-engage potential buyers and drive them toward checkout, significantly increasing overall sales.
Example:
A customer orders a pair of headphones, but leaves their cart before actually making their purchase. Multiple hours have passed before he/she runs across this push message:
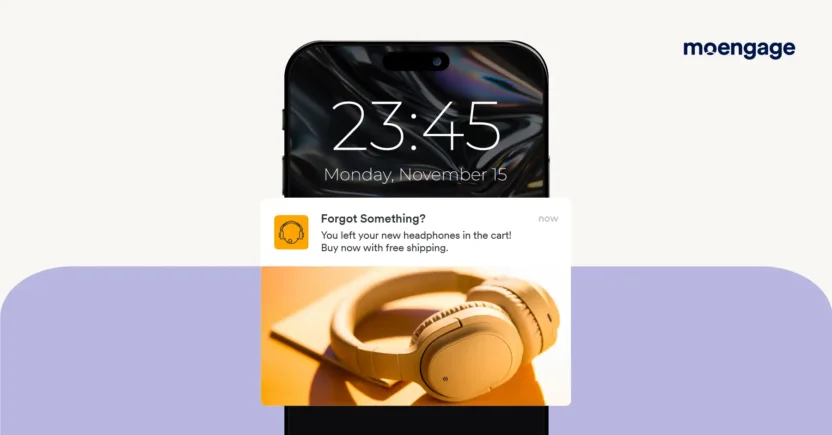
This little reminder prompts the buyer to recall their outstanding purchase and offers an extra incentive (no shipping costs) to complete the transaction.
How to Do It Properly
- Set up automatic abandoned cart reminders.
- Experiment with varied incentive offers (promotions, complimentary delivery, or low-stock alerts).
- Use MoEngage’s Push Amplification to ensure high delivery rates.
- Send a reminder within 24 to 48 hours if they haven’t checked out yet.
3. Urgency-Driven Flash Sales
Fear of missing out or FOMO is arguably advertising’s biggest driver. What would make people act faster? The thought that not taking immediate action would make them miss out on a great offer. Timely offers or flash offers create that sense of urgency that translates to impulsive purchases.
How It Drives Revenue
- Encourages immediate reaction.
- Makes people believe that they have received a special offer.
- Shortens the purchase cycle, driving more conversions.
Example:
A beauty company has a flash sale of their skincare products for 24 hours. To create maximum sense of urgency, they push this message:
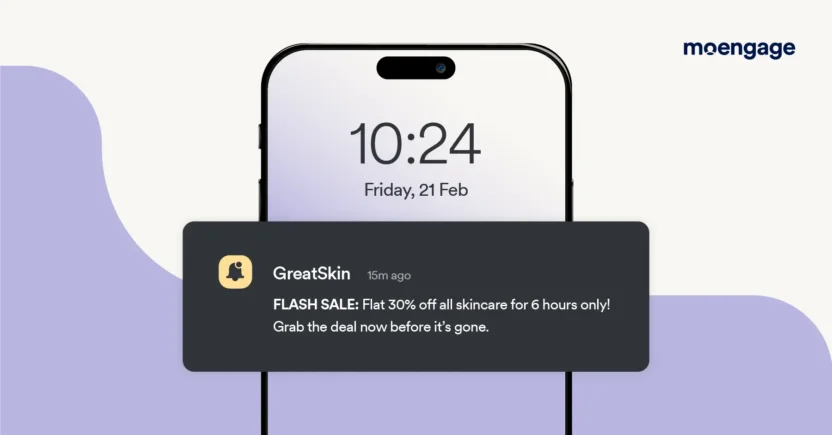
The short span of time and the discount-based appeal make it hard to resist.
How to Do it Properly
- Use urgency-driven words like (“Only X hours left!”, “Hurry! Limited stock only!”, etc.).
- Add a countdown to your website to make the deadline more palpable.
- Schedule reminders towards the close of the sale to reach last-minute shoppers.
- Leverage MoEngage’s Smart Triggers to send notifications based on user behavior.
4. Re-Engagement Campaigns for Inactive Users
Not all users who stop engaging with your app or website are gone for good. Many just need the right cue to come back. Re-engagement push notifications remind inactive users why they loved your brand in the first place and give them a reason to return.
How it Drives ROI
- Increases customer lifetime value.
- Reduces churn rate, which is much cheaper than acquiring new users.
- Win-back campaigns can recover up to 26% of lapsed customers.
Example:
A travel app observes that a user has not planned a journey in three months. Instead of forgetting about the user, they send a tailored push message:

How to Implement It
- Identify inactive users using MoEngage’s Retention Cohorts.
- Offer an exclusive incentive to bring them back.
- Use deep links to take users directly to relevant app sections.
- Personalize messages based on past activity (e.g., “We miss you at XYZ Hotel!”).
5. Gamification & Exclusive Rewards
People love rewards and challenges. Gamification of push messages in your strategy has the potential to drive more engagement, retention, and higher conversion rates. When users feel they are working toward a reward, they stay more engaged with your brand.
How it Drives ROI
- Increases daily usage of the app.
- Encourages users to take more action (purchases, referrals, feedback).
- Loyalty programs have been shown to double purchases by 30%.
Example:
A fitness app wants users to stay active and engaged. They send out a challenge via a push notification:

How to Implement It
- Introduce streak-based challenges, loyalty rewards, or point-based perks.
- Notify users when they are close to unlocking a reward.
- Use MoEngage’s Smart Triggers to send notifications based on user activity.
- Create exclusive VIP rewards for your most loyal users.
6. Turning Unknown Visitors into First-Time Buyers
Not everyone who lands on your website or app is ready to buy immediately. Many visitors are just browsing, and without a little nudge, they might never return. Your task is to turn inactive visitors into shoppers by offering an incentive or focusing on good enough reasons for them to make that move.
How to Do It
- Push a welcome discount to new visitors: “First-timer? Spend 10% off on your first purchase—tap to avail!”
- Create immediacy by adding a countdown: “Exclusive welcome discount of 10% for the next 24 hours!”
- Dynamically segment visitors: Segment those who landed on product pages, but didn’t make any purchase.
By reaching new visitors at the right time, you have greater chances of converting visitors into spenders.
7. Helping Users Get Back on Track with Payments
Sometimes, transactions fail. This can happen for many reasons, including an expired card or simply a forgotten update. At that point, a push message at the right moment can remind them to retry before they forget about it.
How to Do It
- Send an instant reminder for unsuccessful transactions: “Oops! Your transaction failed. Tap to re-enter details and complete your purchase.”
- Alert users to impending renewals to continue service: “Reminder! Your subscription renews in 3 days. Ensure that your payment method is up to date.”
- Provide an incentive to prompt payment resolution: “We found an issue with your payment. Update your billing details now to avoid service disruption and ensure a smooth checkout next time!”
All these reminders at the right moments help prevent users from abandoning their purchases due to small payment glitches—ultimately driving more revenue for you.
Looking for more inspiration? Take a look at these creative push notification ideas and templates!
Push Notification Metrics to Measure: Concluding Thoughts
Push notifications can be a goldmine or just more noise—it all comes down to tracking the right numbers and making smart moves. High CTRs, strong conversions, and low opt-out rates don’t happen by luck. They’re the result of closely monitoring the push notification metrics—Messages Sent, Interactions, and Key Conversions—and refining your approach based on what works.
Want to turn your push strategy into a conversion machine? Explore our powerful push notification solutions or book a demo today to see MoEngage in action!


