Availability of this feature depends on your MoEngage plan and may require a paid add-on. To check what’s available for your plan, refer to Plans and Pricing. To get this feature, contact your MoEngage Customer Success Manager (CSM) or the Support team.
Overview
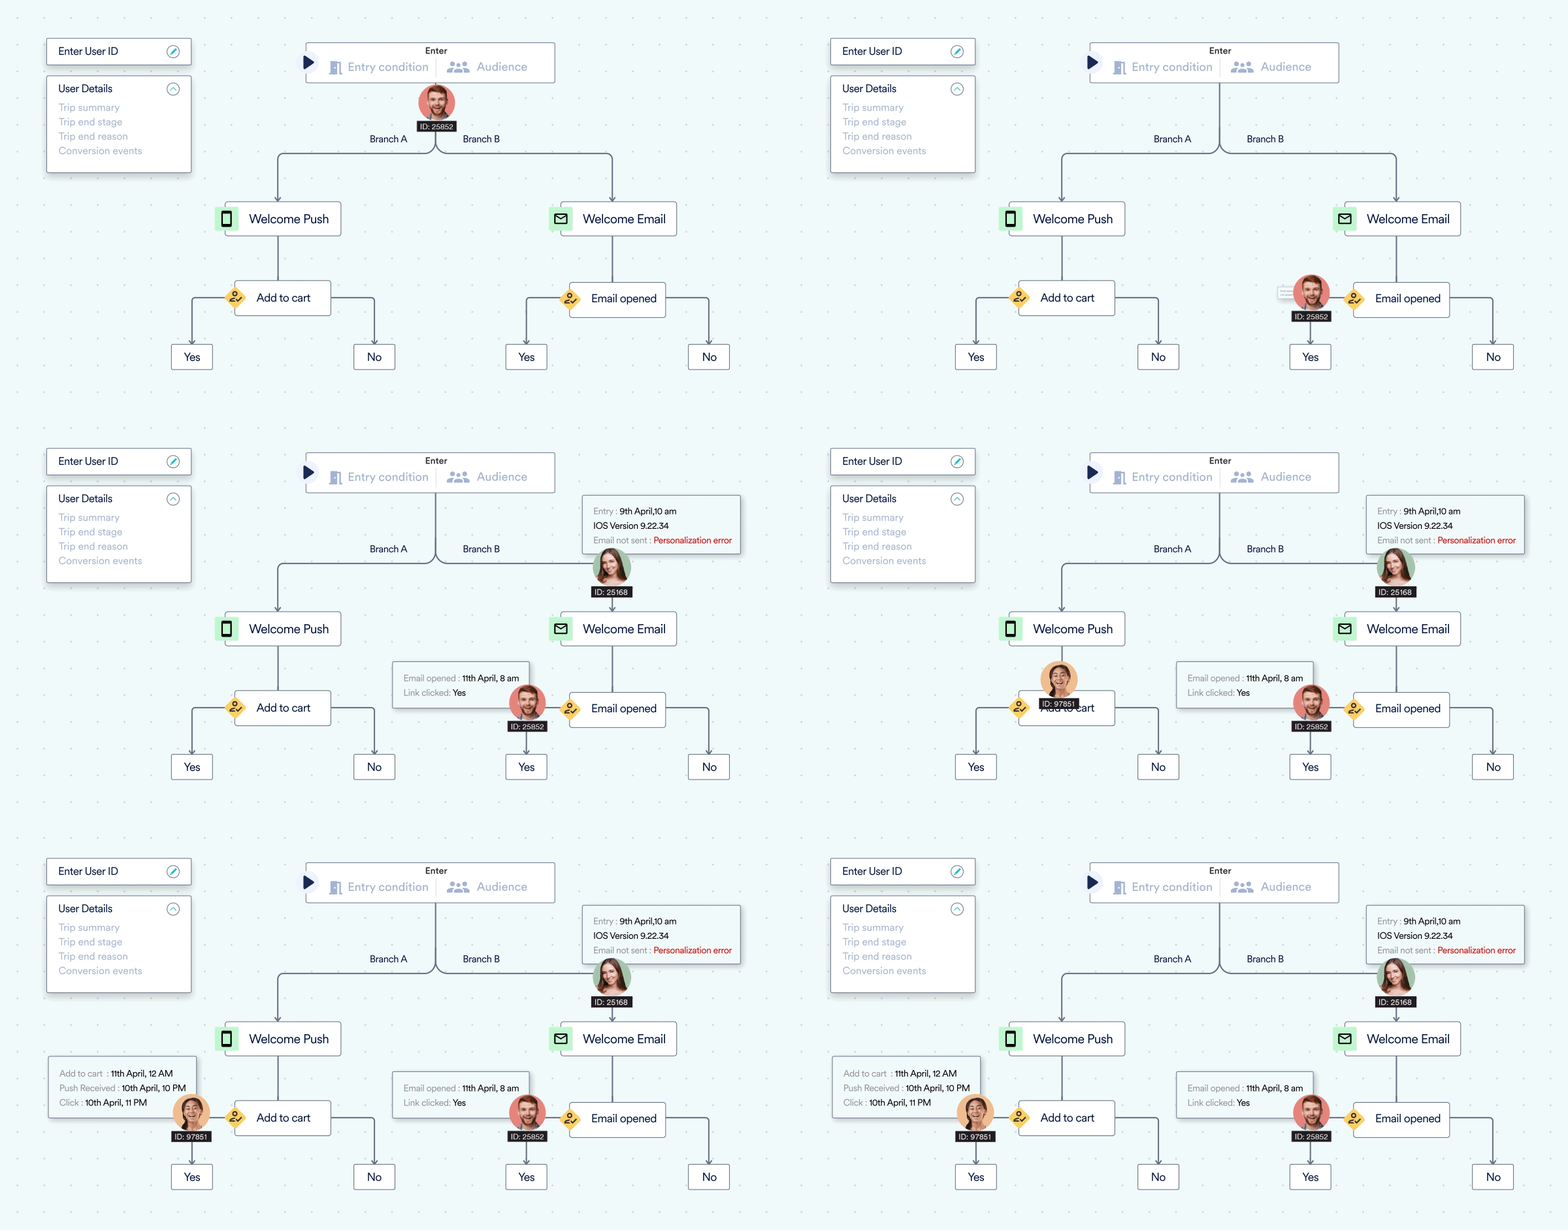
Marketers often seek information about why a user moved along a particular path in a Flow, where they are in the Flow currently, or whether they entered the Flow. With Debug Flows, marketers can understand why a published flow is behaving the way it is. Debug Flows helps them understand the exact path that users are traversing in a published flow by following the journey of a particular target user. This helps them understand why the engagement for a specific campaign in a Flow wasn’t optimal or helps them understand why a user behaved a certain way.Debug Flows is a feature that helps a marketer trace a user’s path in a Flow. This helps validate the performance of a published flow, understand whether flow settings and set-up, such as entry criteria, triggers, and scheduling, are configured correctly, and also helps understand drop-off points or conversions within a specific user or cohort. Using Debug Flows, one can understand the following:
- Why a user did not enter a flow, even after performing a trigger event.
- After entering a flow, why a user did not receive a campaign.
- After a user enters the flow, understand the path they followed, how they engaged with the flow, and where they converted or dropped off.
Debug Flows is available for all Enterprise clients by default. If you are on the Enterprise plan and Debug Flows is not enabled, please contact your MoEngage Customer Success Manager (CSM) or the Support team.
How can you use Debug Flows?
- Understanding why your flow is not performing as per expectations You published a flow; however, viewing your analytics, you realize that the audiences who are receiving the campaign are not the intended audience. Using Debug Flows, you can understand why these audiences were part of the flow and take corrective action accordingly.
- Test the flow for yourself before publishing it for the larger segment/audience You are running a multi-channel customer journey across a large set of audiences. However, before publishing the campaign for the entire segment, you would like to publish it for a smaller set of users (or internal team members) and test it out. With Debug Flows, you can understand the flow performance for the smaller audience set by ‘Shadowing users”, optimize the flow, and accordingly publish the same for a larger audience.
- Debug a flow yourself You have published a flow. However, users are not engaging with the flow as expected. Debug Flows can be used to understand the gaps in the flow setup and make relevant changes.
How does Debug Flows work?
Debug Flows is not available for Fixed Time Flows that is, One-time or Periodic Flows.
- Navigate to the All Flows Page.
- Select the required Flow by clicking on it.
- Navigate to the Debug Flows tab.
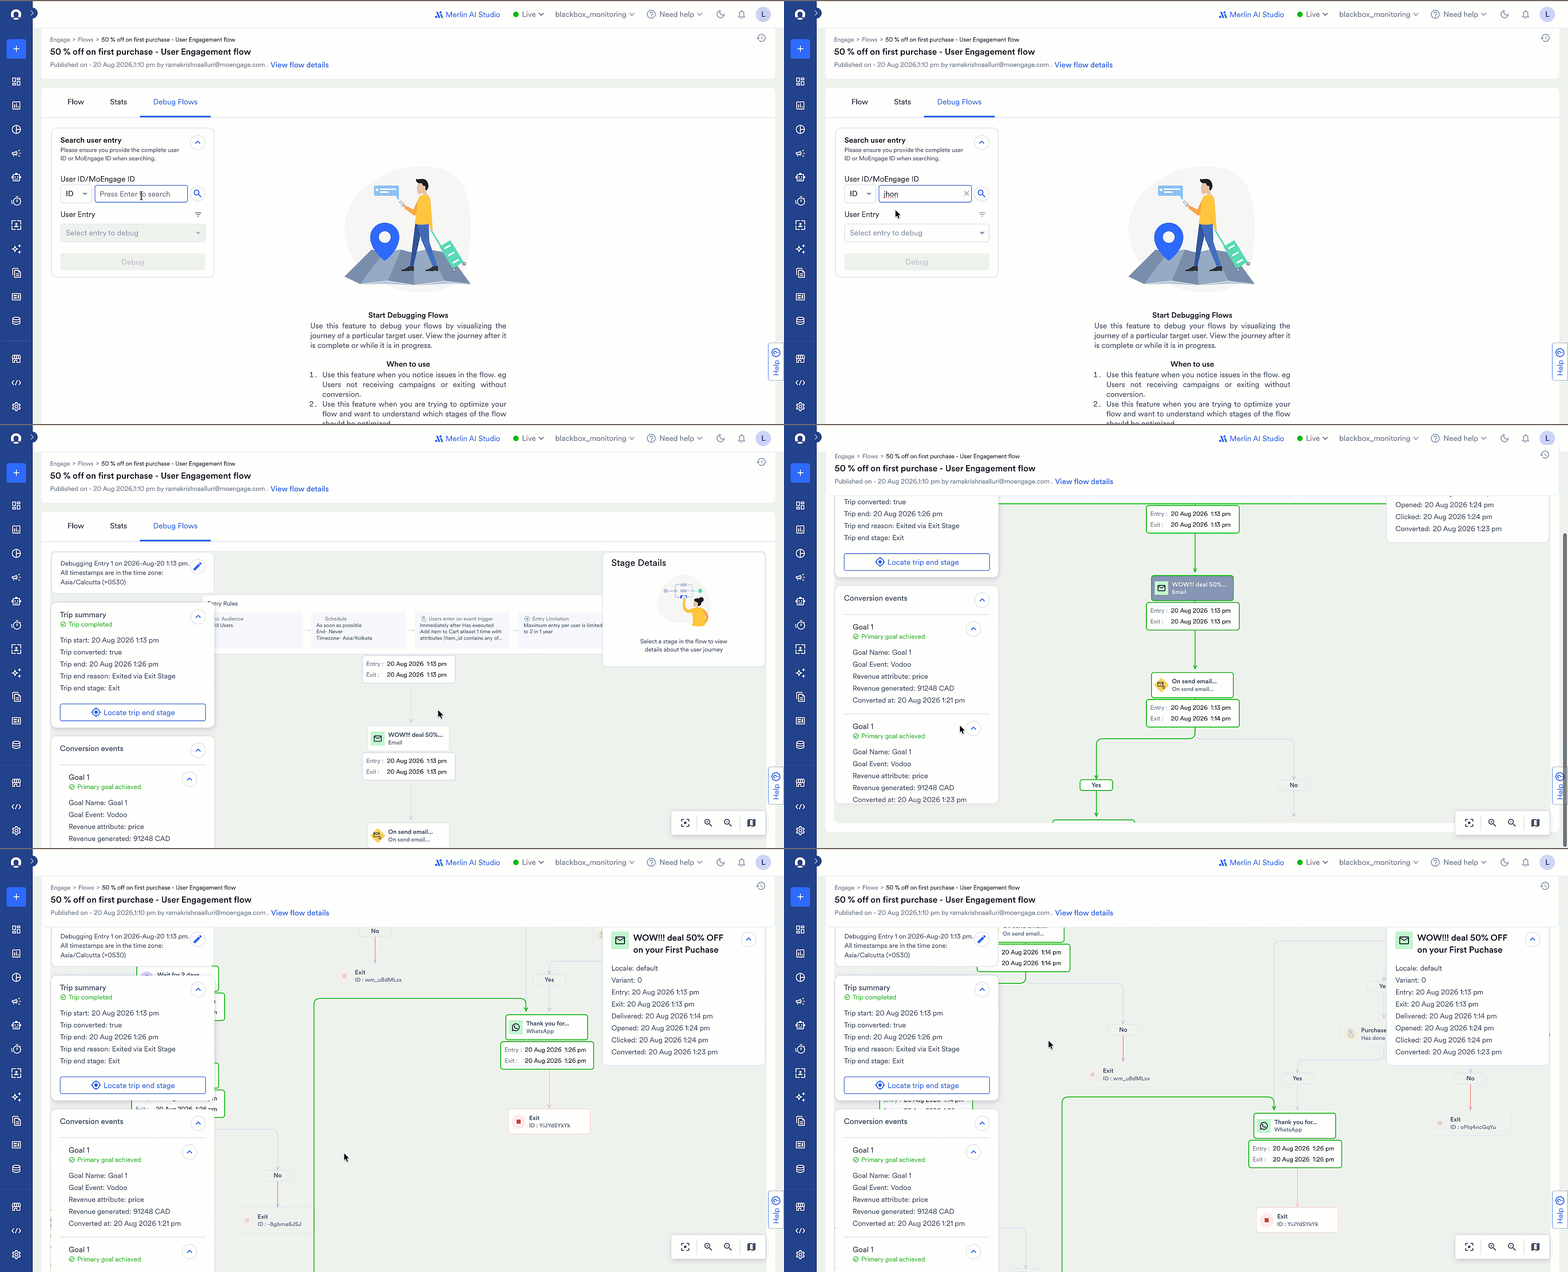
- In the Search user entry search bar, select the user identifier, either ID or MoEngageID, in the list. For more information, refer to User Identifiers.
- Specify the ID or MoEngageID of the user for whom you want to debug the user trips.
- Press Enter. This will populate all the attempts and entries of the user in the Flow for its various versions in the User Entry dropdown.
- You can specify a date range to select the attempts/entries of the user between a specific timeframe by clicking the
 (filter icon) and specifying the date range in the date field. The options available are Yesterday, Last Week, and Custom Range. Note: You cannot look back at a date range greater than 7 days from the current date for debugging.
 - Select the entry or attempt that you wish to look at in the User Entry dropdown and click Debug.
Terms to Know
Viewing Information About a Stage/Action
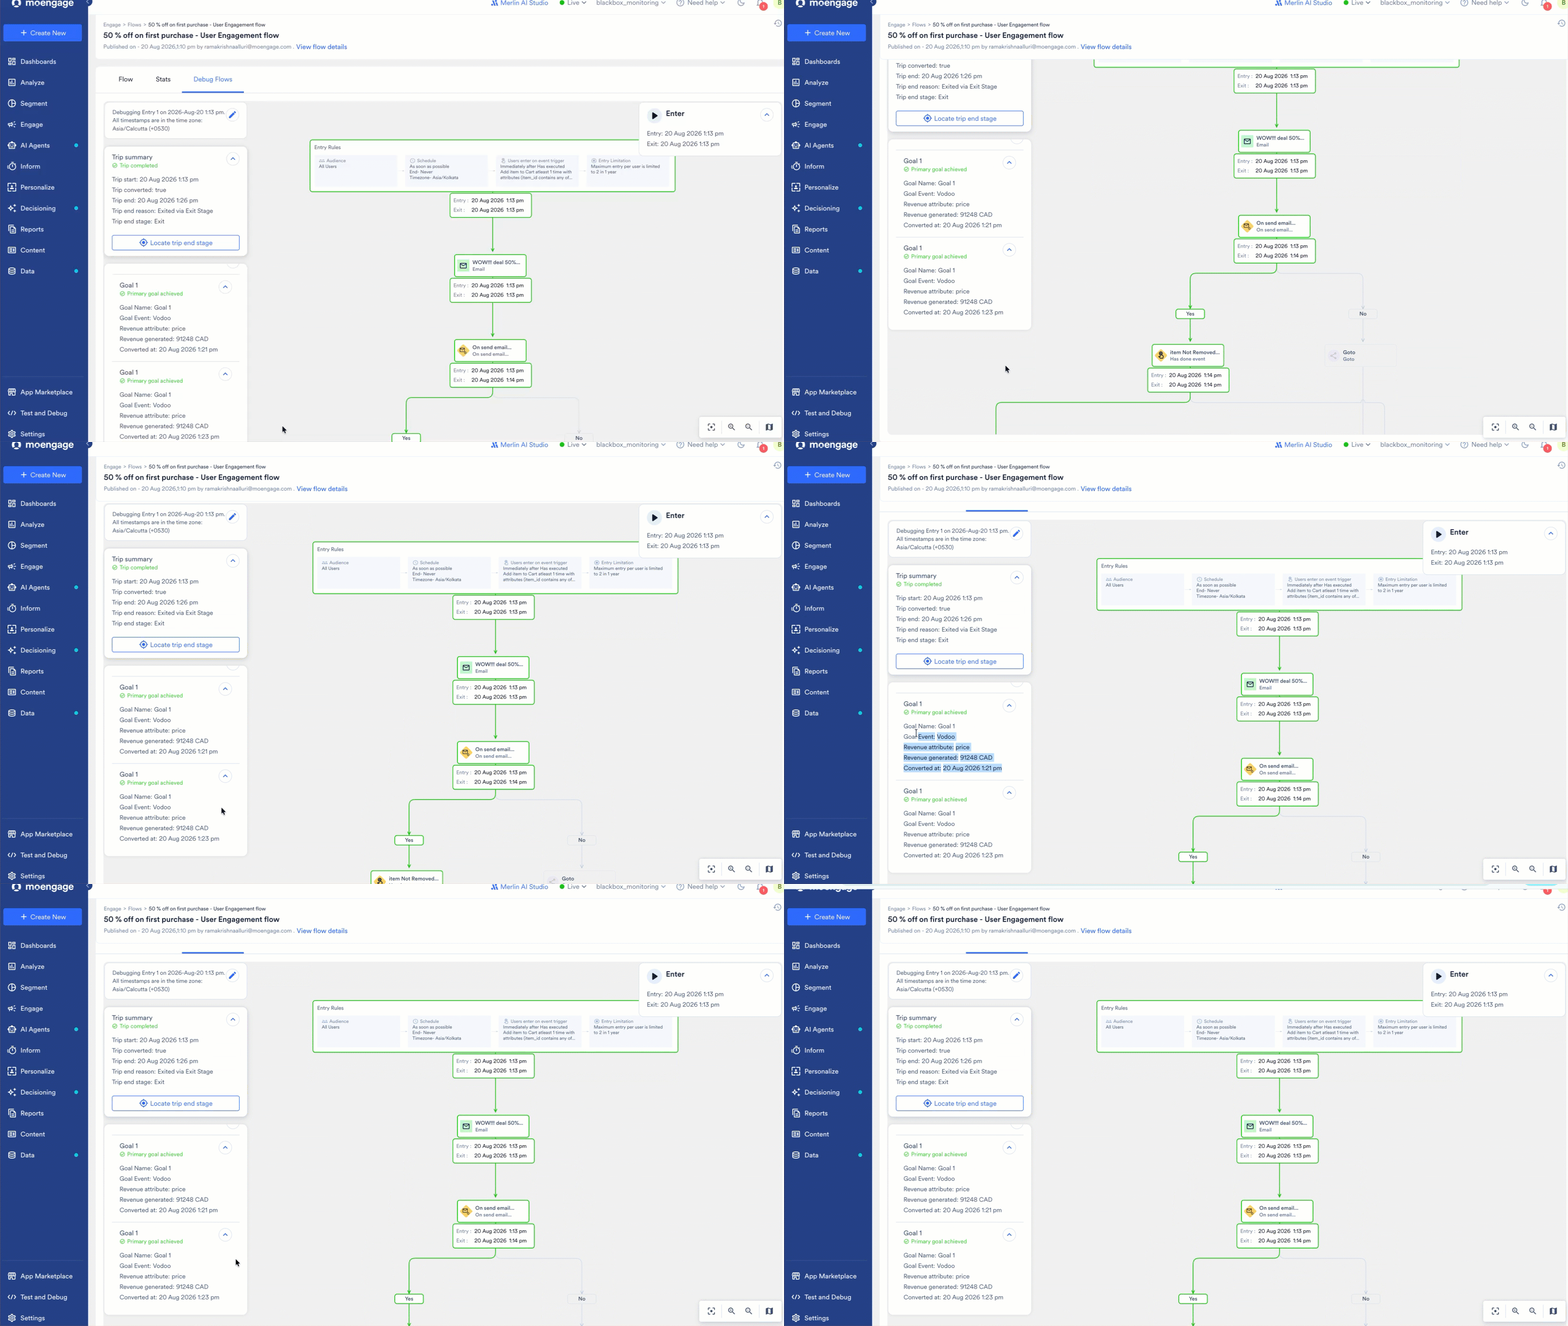
To view the information about a stage or action, or condition, click on the stage, and you will get the details about it on the left of the canvas. For example, if there is an email campaign attached to a Flow and user has moved through that stage, you can click on the campaign and see its status, locale, and variant information, along with when the user entered and exited that stage.Trip Summary
The trip summary section provides information about when the user started the trip and when they exited the flow. The following details are available:- Trip start: The time when the user entered the flow.
- Trip converted: Whether the user converted during the trip.
- Trip end: The time when the user exited the flow.
- Trip end reason: Why the user exited the flow. A user could have exited for one of the following reasons:
- Trip end stage: The stage at which the user exited the flow.
- Locate user: Shows where the user is currently in the flow.
- Locate trip end stage: Shows the stage where the user exited the flow. Flows typically have numerous nodes, multiple branches, and splits, so this option finds the stage for you instead of you searching the canvas.
Debugging a user who moved between versions
When a user moves between versions, Debug Flows lists each version the user entered as a separate entry and numbers the entries in the order they happened. Select the older version’s entry to see where the user left it, and select the newer version’s entry to see where they arrived. The newer entry starts the trip at that stage rather than at the entry stage. On the canvas, an icon above that stage marks where the user entered this version and names the version they came from. The trip summary shows the same information as a note. Click the note to move the canvas to that stage, so that you do not have to find it yourself.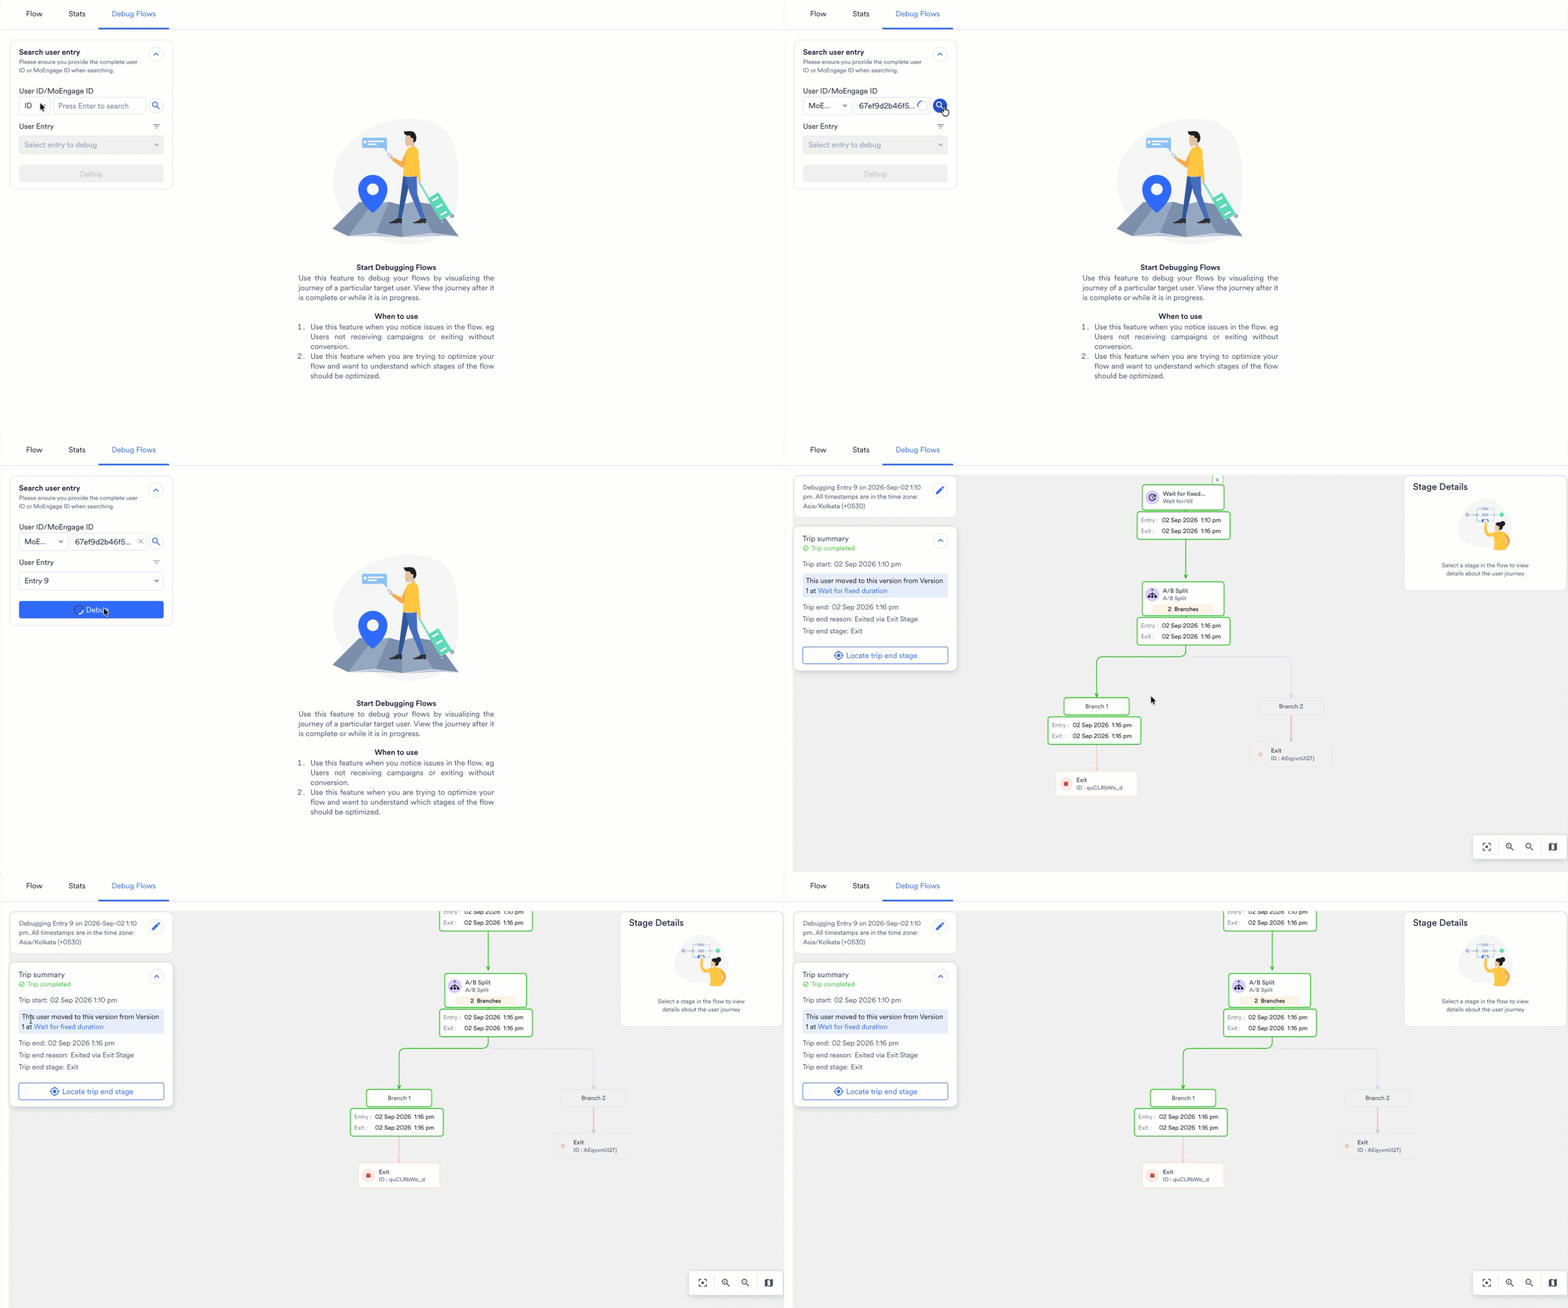
Conversion Events
The conversion events section provides information about when the user has achieved the conversion goals set for the flow.