Step 1: Define Funnel Steps
A funnel is a sequence of events. Consider an example of a product purchase flow with four steps on your app or website. Using this example, we can define an event for each step of the funnel in the order of App Opened, Product Viewed, Added to Cart, and Order Successful.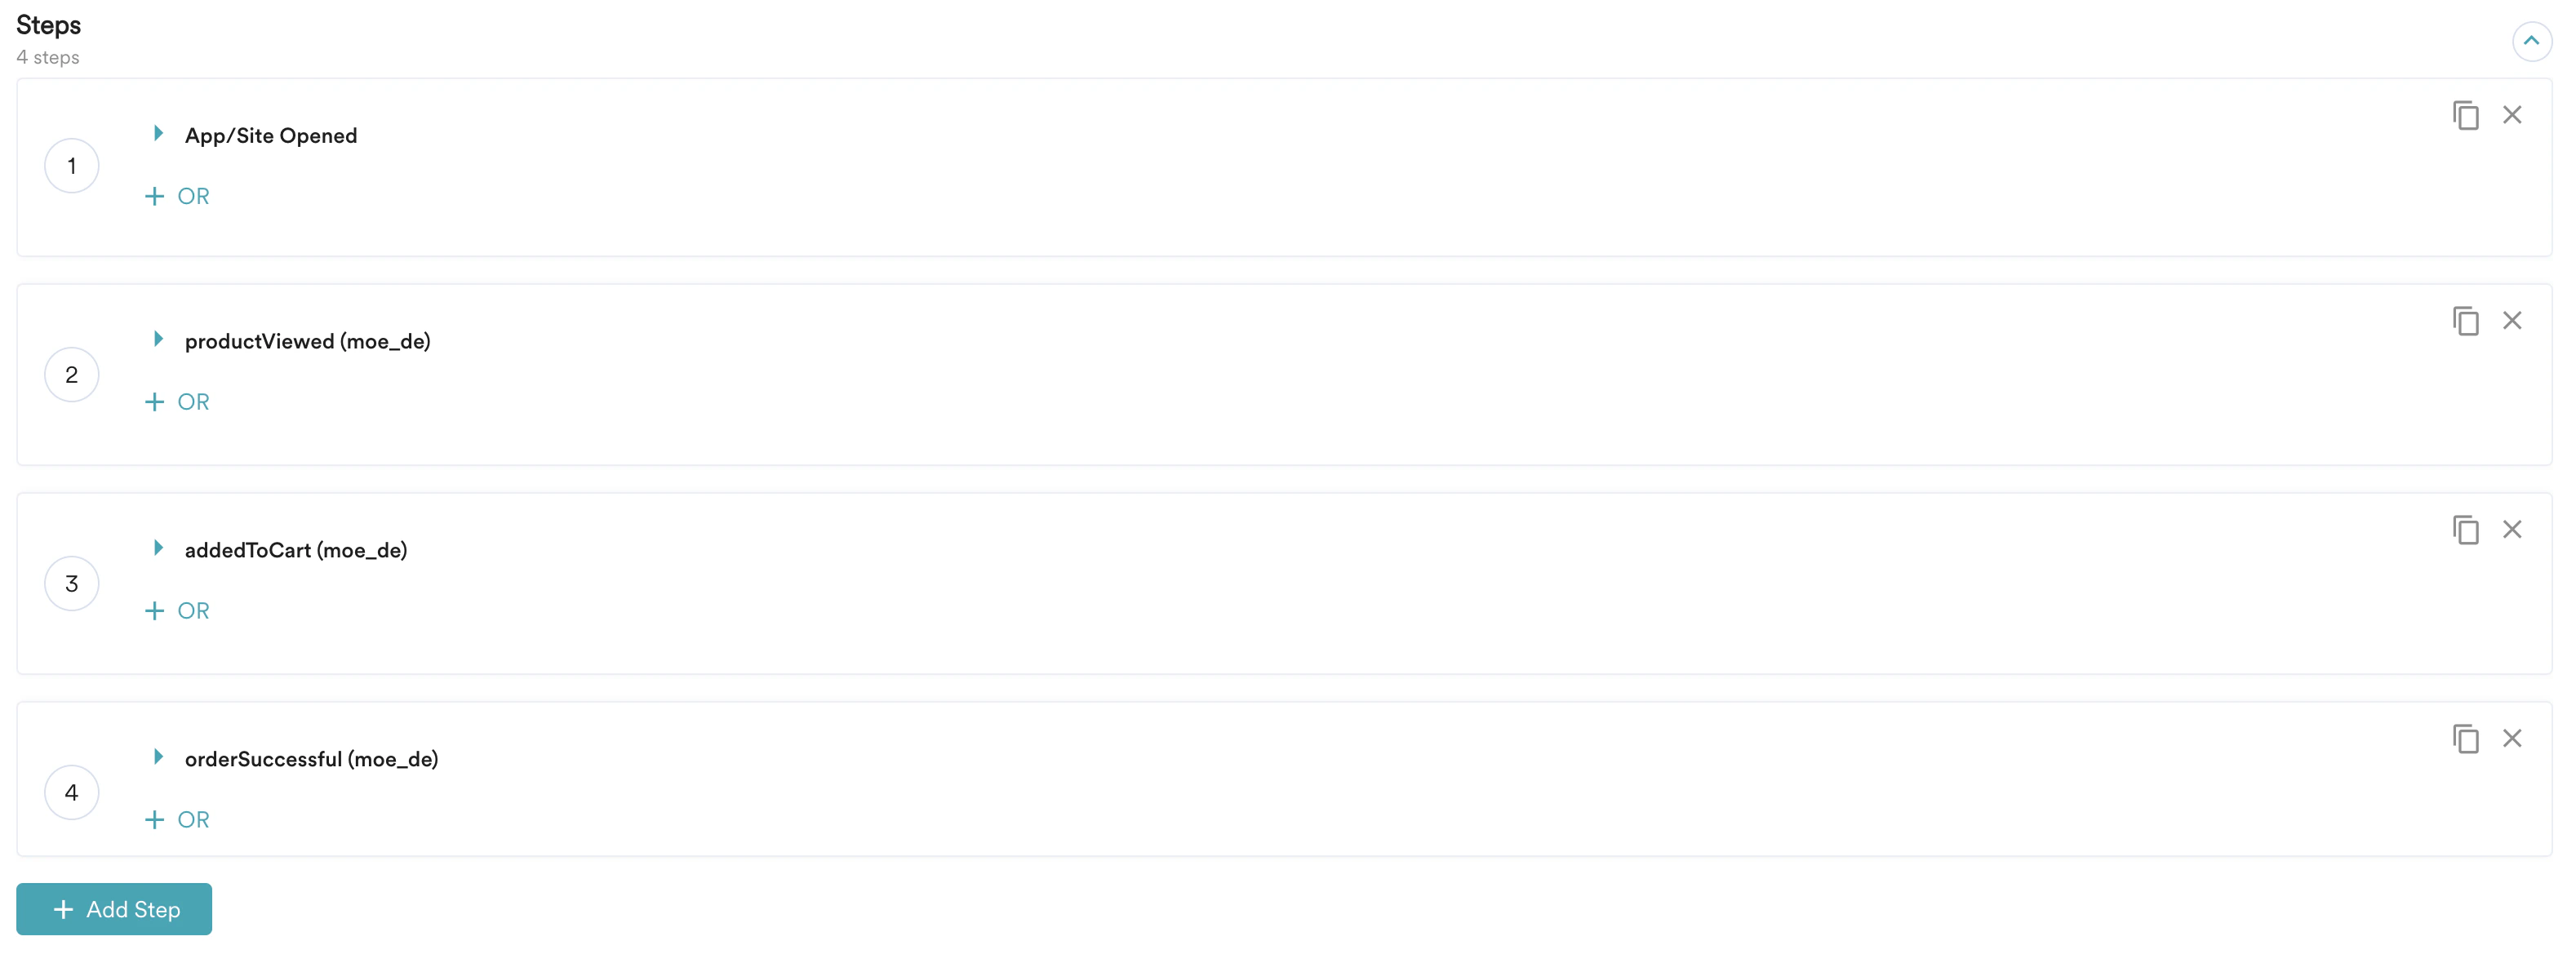
Step 2: Filter Users
By default, you can perform this analysis on all users. However, you can also query for a group of users filtered using User Properties, User Activity, User Affinity, Custom Segments, or any such combination. Filtering users is similar to creating a segment. For more information, refer to Create Segment.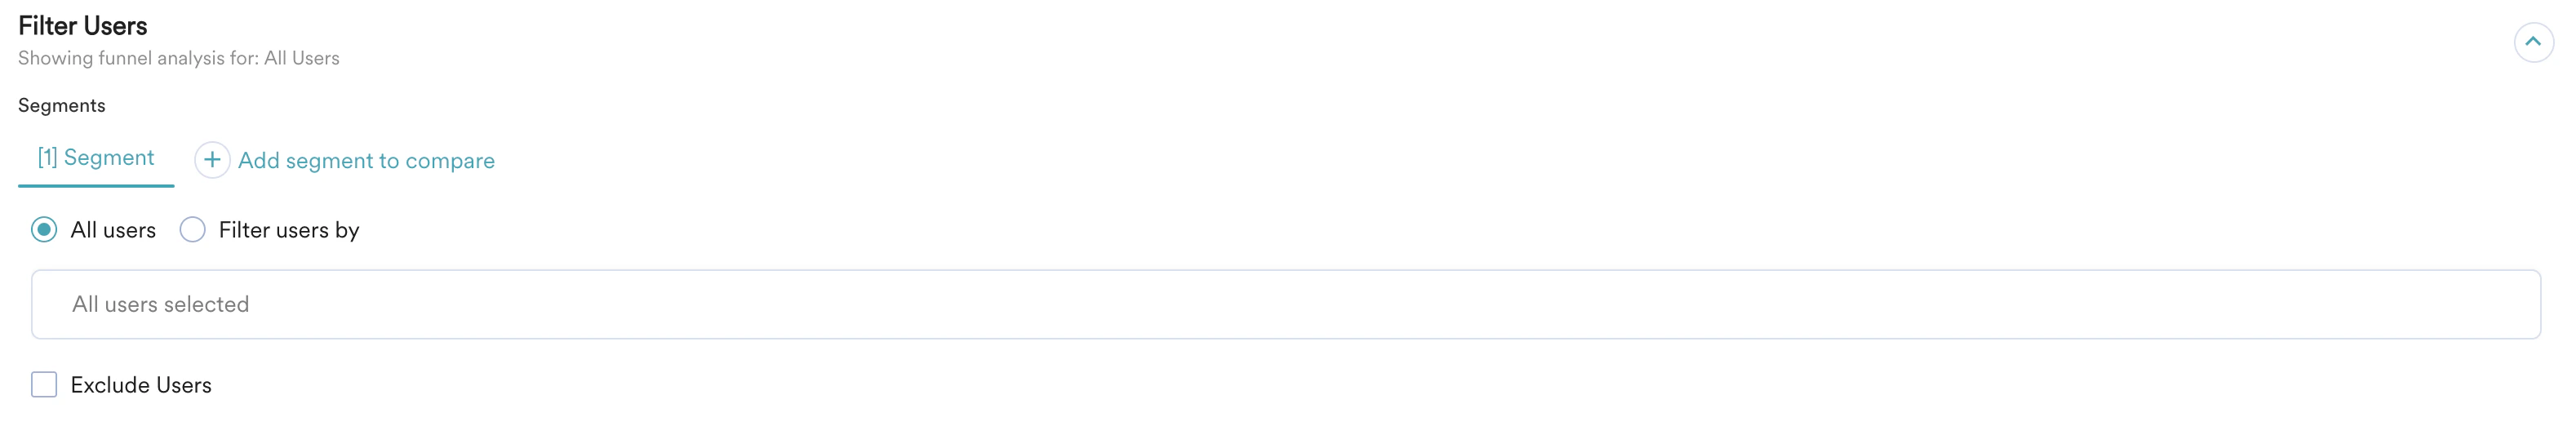
Step 3: Choose Funnel Option
You have the following options to measure the funnel: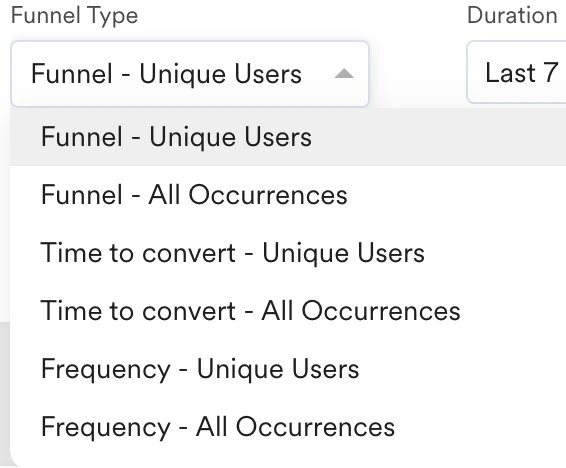
- Funnel - Unique Users: This option counts the number of unique users who have completed the specified steps. In this funnel type, each user is counted only once. If the user completes the entire funnel multiple times, the completion count is one.
- Funnel - All Occurrences: This option counts the total number of funnel step completions. If a user has completed the entire funnel multiple times, all instances of completion are included in the analysis.
Step 4: Configure Funnel
After choosing your funnel type, you have the following options to configure your funnel: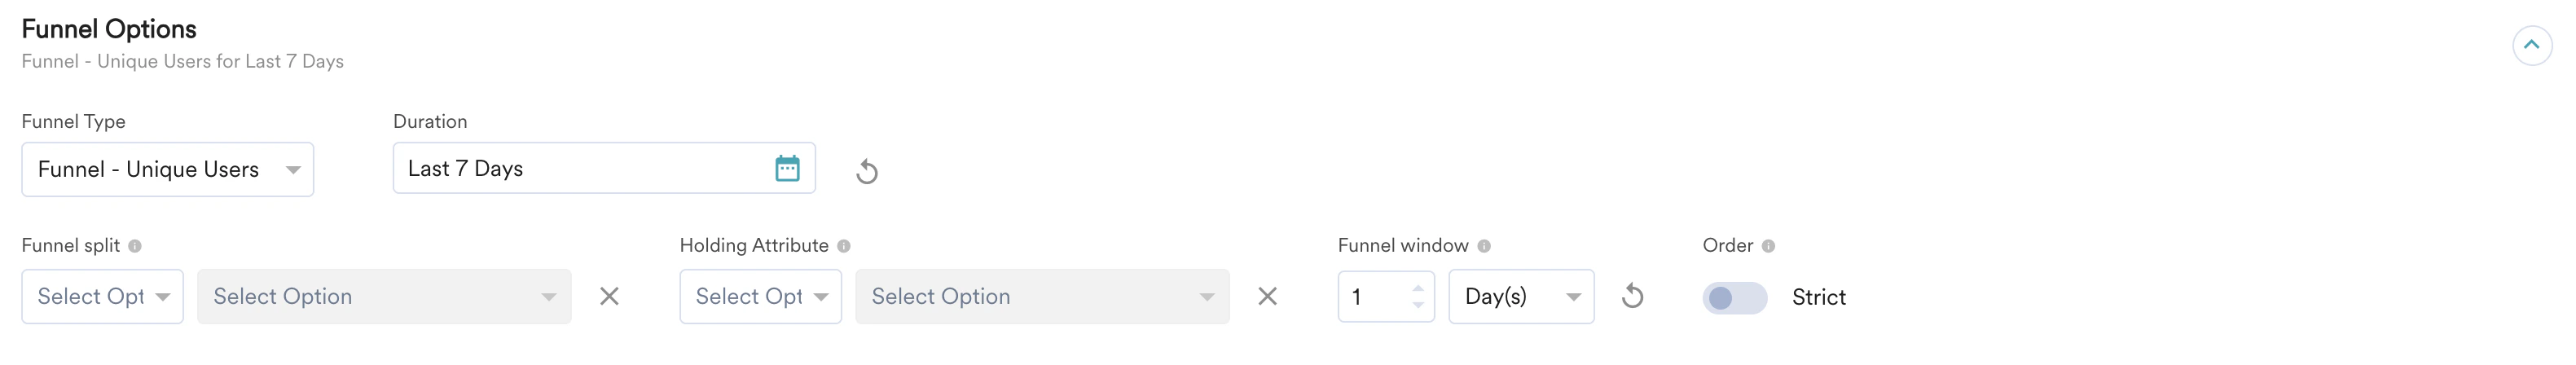
-
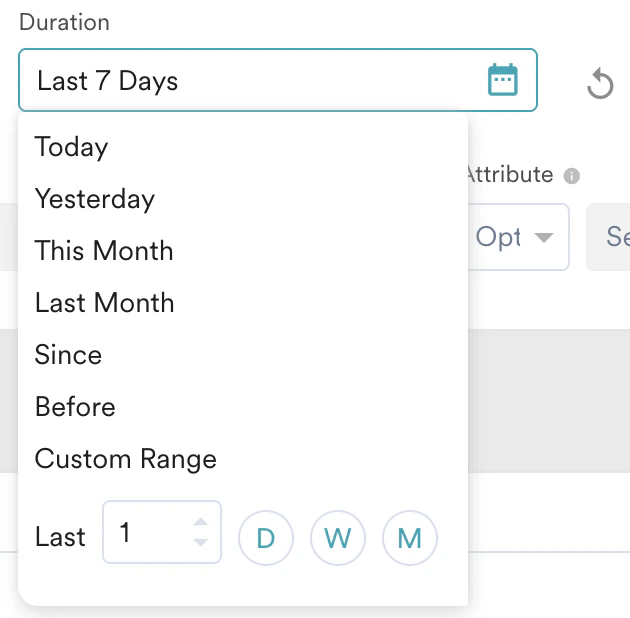
Duration: Here, you can select a duration for your funnel analysis. By default, it is performed for the last 7 days.
-
Funnel split: The funnel split enables comparison of funnels based on the event attribute values. The analysis can be compared to any of the defined step’s event attributes. The funnel analysis is divided into values of the event attribute, and the analysis will be presented in a table and chart. You can compare up to three attributes for split analysis. There are three options to perform a funnel split:
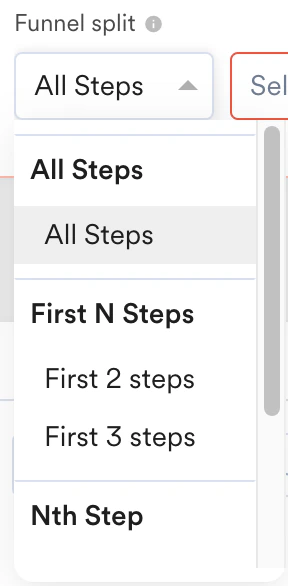
- All Steps: Here, an event attribute must exist across all specified events of the funnel across all steps (including OR and exclude events). All funnel events are first filtered by a specific attribute value, after which funnel analysis is performed on them.
- First N Steps: Here, an event attribute must exist in the first N steps of the funnel (including OR and excluding events). Funnel analysis is performed for each value of the attribute up to the selected Nth steps. MoEngage uses a forward-filling method to complete the funnel analysis for events occurring after the Nth step. With forward filling, a single event can be attributed to multiple funnels.
- Nth Step: Here, the event attributes of the selected Nth step are available for analysis. Ensure that the event attribute is present in all OR events of the defined step. MoEngage performs backward filling, forward filling, or both as required (depending on the step selection).
- Holding Attribute: When an attribute, such as product ID, is carried through multiple steps of the funnel, holding the attribute becomes crucial. The holding attribute constant considers the user and holding attributes as a pair that completes the funnel. You can select a maximum of three attributes.
- Funnel window: The funnel window can be used to analyze whether all the defined steps were completed in a specific amount of time. For instance, if you would like to see how many users opened the app (first step) and then made a purchase (last step) within 5 minutes, you can set this limit as the funnel window.
- Order: Turning the Strict toggle on considers user events or activities based on the sequence defined in the funnel steps. A Strict Order funnel displays the number of users who have completed all steps in the specified order without performing any steps out of sequence.
Step 5: Choose Charts
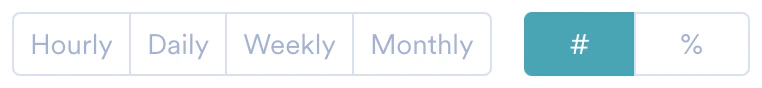
After your chart is generated, depending on the type of data, you can switch the chart view for better visualization. You can choose between a line chart or a bar chart to view progress, compare volumes over a time period, or compare absolute numbers.
Step 6: Tables
In addition to charts, the data is also available for analysis in a tabular format. You can sort the table or change its view using the transpose feature. Additionally, you can download the data in CSV format. For more information, refer here.Save to My Studio or Custom Dashboard
Your analysis is now ready. To access this later, you can save the analysis. To save:- Click the icon in the upper-right corner and click Save to My Studio.
-
Additionally, you can save the analysis to a custom dashboard. Choose the required option from the list:
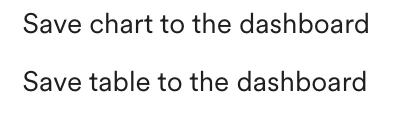
-
Select the dashboard where you want to save the analysis. You can choose an existing dashboard or create a new one.
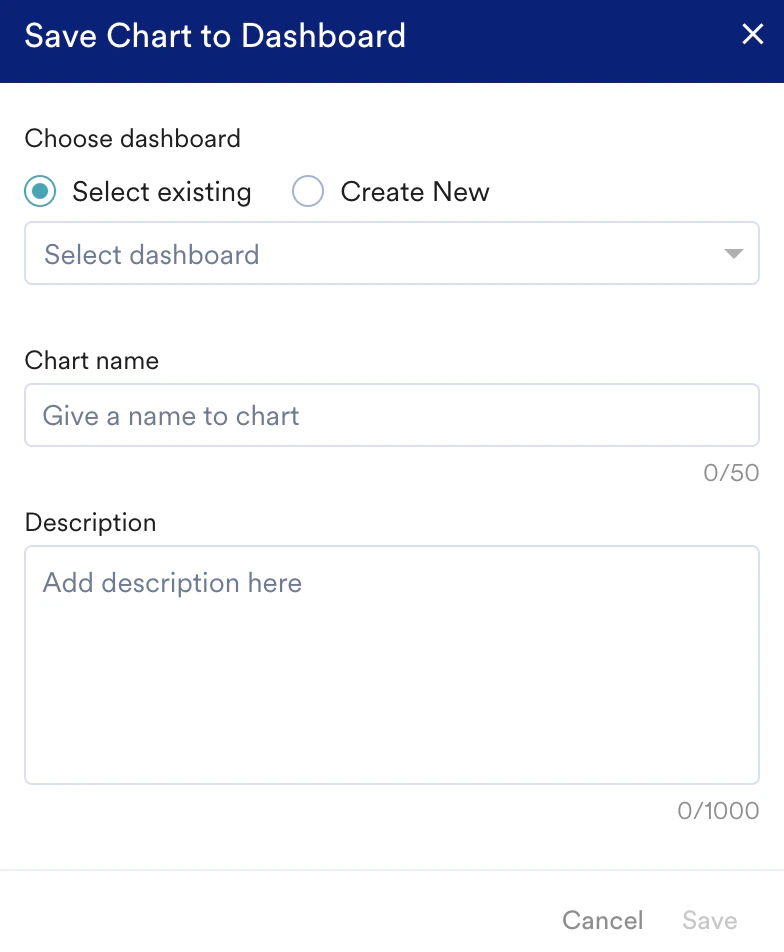
- Enter a name for your analysis to help you identify.
- Enter a brief description of the analysis.
- Click Save.